")
52896WA Advanced Diploma of Civil and Structural Engineering (Materials Testing)
Investigation of the properties of construction materials, the principles which…Read more")
Graduate Diploma of Engineering (Safety, Risk and Reliability)
The Graduate Diploma of Engineering (Safety, Risk and Reliability) program…Read more
Professional Certificate of Competency in Fundamentals of Electric Vehicles
Learn the fundamentals of building an electric vehicle, the components…Read more
Professional Certificate of Competency in 5G Technology and Services Overview
Learn 5G network applications and uses, network overview and new…Read more
Professional Certificate of Competency in Clean Fuel Technology - Ultra Low Sulphur Fuels
Learn the fundamentals of Clean Fuel Technology - Ultra Low…Read more
Professional Certificate of Competency in Battery Energy Storage and Applications
Through a scientific and practical approach, the Battery Energy Storage…Read more
52910WA Graduate Certificate in Hydrogen Engineering and Management
Hydrogen has become a significant player in energy production and…Read more
Professional Certificate of Competency in Hydrogen Powered Vehicles
This course is designed for engineers and professionals who are…Read more
Electrical Drawings and Schematics
THIS BOOK WAS DEVELOPED BY IDC TECHNOLOGIES
WHO ARE WE?
IDC Technologies is internationally acknowledged as the premier provider of practical, technical training for engineers and technicians.
We specialize in the fields of electrical systems, industrial data communications, telecommunications, automation and control, mechanical engineering, chemical and civil engineering, and are continually adding to our portfolio of over 60 different workshops. Our instructors are highly respected in their fields of expertise and in the last ten years have trained over 200,000 engineers, scientists and technicians.
With offices conveniently located worldwide, IDC Technologies has an enthusiastic team of professional engineers, technicians and support staff who are committed to providing the highest level of training and consultancy.
TECHNICAL WORKSHOPS
TRAINING THAT WORKS
We deliver engineering and technology training that will maximize your business goals. In today’s competitive environment, you require training that will help you and your organization to achieve its goals and produce a large return on investment. With our ‘training that works’ objective you and your organization will:
- Get job-related skills that you need to achieve your business goals
- Improve the operation and design of your equipment and plant
- Improve your troubleshooting abilities
- Sharpen your competitive edge
- Boost morale and retain valuable staff
- Save time and money
EXPERT INSTRUCTORS
We search the world for good quality instructors who have three outstanding attributes:
- Expert knowledge and experience – of the course topic
- Superb training abilities – to ensure the know-how is transferred effectively and quickly to you in a practical, hands-on way
- Listening skills – they listen carefully to the needs of the participants and want to ensure that you benefit from the experience.
Each and every instructor is evaluated by the delegates and we assess the presentation after every class to ensure that the instructor stays on track in presenting outstanding courses.
HANDS-ON APPROACH TO TRAINING
All IDC Technologies workshops include practical, hands-on sessions where the delegates are given the opportunity to apply in practice the theory they have learnt.
REFERENCE MATERIALS
A fully illustrated workshop book with hundreds of pages of tables, charts, figures and handy hints, plus considerable reference material is provided FREE of charge to each delegate.
ACCREDITATION AND CONTINUING EDUCATION
Satisfactory completion of all IDC workshops satisfies the requirements of the International Association for Continuing Education and Training for the award of 1.4 Continuing Education Units.
IDC workshops also satisfy criteria for Continuing Professional Development according to the requirements of the Institution of Electrical Engineers and Institution of Measurement and Control in the UK, Institution of Engineers in Australia, Institution of Engineers New Zealand, and others.
CERTIFICATE OF ATTENDANCE
Each delegate receives a Certificate of Attendance documenting their experience.
100% MONEY BACK GUARANTEE
IDC Technologies’ engineers have put considerable time and experience into ensuring that you gain maximum value from each workshop. If by lunchtime on the first day you decide that the workshop is not appropriate for your requirements, please let us know so that we can arrange a 100% refund of your fee.
ONSITE WORKSHOPS
All IDC Technologies Training Workshops are available on an on-site basis, presented at the venue of your choice, saving delegates travel time and expenses, thus providing your company with even greater savings.
OFFICE LOCATIONS
AUSTRALIA • CANADA • INDIA • IRELAND • MALAYSIA • NEW ZEALAND • POLAND • SINGAPORE • SOUTH AFRICA • UNITED KINGDOM • UNITED STATES
idc@idc-online.com www.idc-online.com
Visit our website for FREE Pocket Guides
IDC Technologies produce a set of 6 Pocket Guides used by thousands of engineers and technicians worldwide.
Vol. 1 – ELECTRONICS
Vol. 2 – ELECTRICAL
Vol. 3 – COMMUNICATIONS
Vol. 4 – INSTRUMENTATION
Vol. 5 – FORMULAE & CONVERSIONS
Vol. 6 – INDUSTRIAL AUTOMATION
To download a FREE copy of these internationally best selling pocket guides go to: www.idc-online.com/downloads/

Presents
Electrical Drawings and Schematics
Niranjana Roy – B.SC Electrical Engineering
Revision 3
Website: www.idc-online.com
E-mail: idc@idc-online.com
IDC Technologies Pty Ltd
PO Box 1093, West Perth, Western Australia 6872
Offices in Australia, New Zealand, Singapore, United Kingdom, Ireland, Malaysia, Poland, United States of America, Canada, South Africa and India
Copyright © IDC Technologies 2011. All rights reserved.
First published 2008
All rights to this publication, associated software and workshop are reserved. No part of this publication may be reproduced, stored in a retrieval system or transmitted in any form or by any means electronic, mechanical, photocopying, recording or otherwise without the prior written permission of the publisher. All enquiries should be made to the publisher at the address above.
ISBN: 978-1-921007-66-8
Disclaimer
Whilst all reasonable care has been taken to ensure that the descriptions, opinions, programs, listings, software and diagrams are accurate and workable, IDC Technologies do not accept any legal responsibility or liability to any person, organization or other entity for any direct loss, consequential loss or damage, however caused, that may be suffered as a result of the use of this publication or the associated workshop and software.
In case of any uncertainty, we recommend that you contact IDC Technologies for clarification or assistance.
Trademarks
All logos and trademarks belong to, and are copyrighted to, their companies respectively.
Acknowledgements
IDC Technologies expresses its sincere thanks to all those engineers and technicians on our training workshops who freely made available their expertise in preparing this manual.
Contents
1 Engineering Drawings for Electrical Engineers – An Introduction 1
1.1 Drawings – their relevance to engineering 1
1.2 Origin of worldwide standards in electro-technology 4
1.3 Purposes served by different types of drawings 5
1.4 Standards in a drawing office 12
1.5 Organization of a typical drawing office 17
1.6 Printing, distribution and control of copies 20
1.7 Summary 24
2 Components of a Drawing, Drawing Sizes and Scales 27
2.1 Typical engineering drawings 28
2.2 Various categories of electrical drawings 31
2.3 Planning your drawing 33
2.4 Title block in a drawing and what it should contain 40
2.5 Legend block 43
2.6 Bill of materials block 44
2.7 Drawing notes block 44
2.8 Revision history, revision numbering and use of revision marks 45
2.9 Summary 47
3 Symbols Used in Electro-technology and Governing Standards 49
3.1 Types of drawings that need symbols 49
3.2 Symbols as per electro-technology standards 52
3.3 Use of non standard symbols 70
3.4 Use of color and line types in representing various services 70
3.5 Company standards for drawings 72
3.6 Summary 73
4 Single Line and Three Line Diagrams 75
4.1 Purpose 75
4.2 Typical examples 77
4.3 The differences between single line and the 3-line diagram 83
4.4 Applications 84
4.5 Conventions 85
4.6 Summary 90
Exercises 91
5 Schematic Diagrams 93
5.1 Purpose 93
5.2 Typical examples 94
5.3 Control devices – electromechanical relays and contactors 97
5.4 Use of symbols 100
5.5 Applications 102
5.6 Schematics spread over a number of sheets 103
5.7 Cross referencing between coils and contacts 114
5.8 Summary 114
Exercises 115
6 Logic Diagrams 117
6.1 Purpose 117
6.2 Logic gates 118
6.3 Typical examples 125
6.4 Symbols 126
6.5 Applications 128
6.6 Logic diagrams spread over a number of sheets 128
6.7 Cross referencing 130
6.8 Summary 130
Exercises 130
7 Cabling and Wiring Drawings 135
7.1 Purpose 135
7.2 Sub types of cabling and wiring drawings 137
7.3 Conventions used 161
7.4 Summary 161
Exercises 162
8 Layout drawings 163
8.1 Purpose 163
8.2 Conventions used for layout drawings 164
8.3 Sub types of layout drawings 171
8.4 Applications of layout drawings 200
8.5 Summary 201
Exercises 202
9 Advances arising from Computer Aided Drafting (CAD) 203
9.1 Drawing office revolution by CAD and the role of PC based CAD applications 203
9.2 2D and 3D applications and links to CAM 206
9.3 Drawing to true dimensions in CAD applications 212
9.4 Use of symbols, attributes and symbol libraries 214
9.5 Automated bill of material generation from a CAD drawing 221
9.6 Information sharing on multi-disciplinary drawing 221
9.7 Concept of layers and their use in sharing information 222
9.8 Automation of drawing through programming 224
9.9 Linking imagery with drawings – GIS related applications 232
9.10 Summary 239
10 Management of drawings 241
10.1 Planning and assigning of drawings 241
10.2 Need for drawing numbering standards 243
10.3 Drawing process flow 245
10.4 Revision control and ownership of drawing 248
10.5 Comments and their marking 248
10.6 Drawing management system for work flow control 249
10.7 On-line distribution of drawings – the end of the era of paper drawings 253
10.8 Drawing as a database for engineering and construction – the future 253
10.9 Summary 254
Appendix A – Blank Drawing Sheet 257
Appendix B – Answers to Exercises 259
1
Engineering Drawings for Electrical Engineers – An Introduction
This chapter explains the need for the development of engineering drawings as part of the problem solving for the engineers and their relevance to the various departments of an engineering organization. It also explains the various steps involved in the development of drawings; their release and control with reference to the accepted standards.
Learning objectives
- To provide the reader with an overview of the relevance of drawings in an engineering environment and the purpose served by different types of drawings.
- To familiarize the reader briefly with the history of origin of worldwide standards in electro technology and also the standards and procedures usually followed by organizations for development and control of drawings.
1.1 Drawings – their relevance to engineering
One of the most effective ways of communicating one’s ideas is through drawings or graphics. For many years various types of drawings, sketches and paintings have been used to convey ideas and information. A good recognizable picture reduces ambiguity while discussing a project. The two basic skills required by an engineer are: to plan the work and then to work the plan. Engineers and technical personnel associated with an engineering organization use drawings to convey graphically the ideas and plan necessary for execution and completion of a project involving construction or assembly of components or systems.
1.1.1 Drawings as a tool for problem solving
The drawings help the engineering process problem solving in the following ways:
- It provides the geometric form of the design.
- It acts as a communication tool between the designers and the manufacturing/construction personnel.
- It acts as an analysis tool and helps decide and calculate some of the unknown dimensions and tolerances.
- It acts as a design simulator.
- It checks the completeness of the design and helps the designers identify the missing parameters.
1.1.2 Drawings as a tool used at various stages of working in an organization
The drawings help the engineering organization during the various stages as mentioned below:
- Tendering stage: It helps in transforming the needs of the client into the world of the designer. It helps in procuring an accurate quote and also helps in avoiding future disputes arising out of discrepancies due to lack of information.
- Design and engineering stage: The drawings at the designing stage are a tool for data representation for the design engineers as the designer conveys the information in the form of design. During detailed engineering stage the drawing helps the engineers work out the detailed bill of materials which is further used by the procurement department.
- Construction or assembly stage: The drawings in this stage help the technical personnel at the construction site or the assembly shop in carrying out the process smoothly and with minimum ambiguity.
- Operation and maintenance stage: At this stage the drawings are the key help for the day to day operation and maintenance for the technicians. It helps them identify any anomaly occurring in the system quickly and carry out the rectifications.
1.1.3 Drawings at the centre of the various activities of an engineering organization
The drawings are at the centre of activities taking place in an engineering organization whether a manufacturing organization or a turnkey contracting organization. The cycle of activities taking place in a manufacturing organization is explained in Figure 1.1 and the cycle of activities taking place in a contracting organization is explained in Figure 1.2.

Cycle of activities in a manufacturing organization

Cycle of activities in a construction organization
1.2 Origin of worldwide standards in electro-technology
The nineteenth century saw major technological inventions in the field of electro-technology. Before this period although the units of measurement for electrical parameters had been established, the standardization of the electrical equipments had not taken place with the result that it was difficult for the manufacturers, users and local authorities to make comparison between products of the same type. Manufacturers also felt that for repetitive productions some sort of design codes were necessary and also some sort of quality guaranteeing institution was needed to guarantee their products for reducing competition in the local and the international market.
1.2.1 Standards and their necessity
- Market growth for new and emerging technologies
- Reduced development time and cost
- Sound engineering practices
- Decreased trading costs and lowered trade barriers
- Increased product quality and safety
- Reduced market risks
- Protection against obsolescence
With these ideas countries in the different parts of the world started forming their own standardizing bodies. Examples are ANSI, BS, AS, DIN, etc. Also some of the industry-bodies formulate standards specific to those industrial segments. Examples are NEMA, API, IEEE, VDE, etc.
In engineering drawings too, standards had to be established to ensure that a drawing can be read and understood by anyone who uses it by adopting a common set of symbols and terminology. Moreover, standards are necessary to make a drawing presentable and easy to read by adopting proper arrangement of information on a sheet, appropriate sheet sizing, applying proper scaling, use of correctly-sized lettering for text and dimension markers, legends and bill of materials information, title contents and so on. While some of the above features are specific to the company, which makes a drawing, others need to be standardized across the entire industry. Such common standards have been evolved by the International Standards Organisation (ISO) and International Electro-technical Commission (IEC) and are adopted widely by the engineering industry the world over.
A brief description and constitution of the major standardizing bodies representing electrical and allied disciplines is given below.
Institution of Electronic and Electrical Engineers (IEEE)
With nearly 1,300 standards either completed or under development, IEEE is a central source of standardization in both traditional and emerging fields, particularly telecommunications, information technology and power generation.
National Electrical Manufacturers Association (NEMA)
It provides a forum for the standardization of electrical equipment, enabling consumers to select from a range of safe, effective, and compatible electrical products.
Association of German Electrical Engineers (VDE)
The VDE is the German Association for Electrical, Electronic and Information Technologies, a professional body based in Frankfurt. The role of the VDE in Germany is comparable to that of the IEEE in the US. Its main activity is as a standards organization.
International electro-technical Commission (IEC)
The International Electro technical Commission (IEC) is the leading global organization that prepares and publishes international standards for all electrical, electronic and related technologies. These serve as a basis for national standardization and as references when drafting international tenders and contracts. ISO (the International Organization for Standardization) and IEC (the International Electro technical Commission) form the specialized system for worldwide standardization.
International Standards Organisation
ISO is a network of the national standards institutes of 157 countries, on the basis of one member per country, with a Central Secretariat in Geneva, Switzerland, that coordinates the system. ISO is a non-governmental organization: its members are not delegations of national governments. Many of its member institutes are no doubt part of the governmental structure of their countries, or are mandated by their government but other members have their roots uniquely in the private sector, having been set up by national partnerships of industry associations.
1.3 Purposes served by different types of drawings
Technical drawings are used to convey a large amount of exact, detailed information in an abbreviated language. They consist of lines, symbols, dimensions, and notations to accurately convey an engineer’s designs to electricians/technicians who install the electrical system on a job. Technical drawings are used to convey a large amount of exact, detailed information in an abbreviated language. They consist of lines, symbols, dimensions, and notations to accurately convey an engineer’s designs to electricians/technicians who install the electrical system on a job.
The types of technical drawings used for any project can be broadly categorized as two-dimensional and three-dimensional drawings.
1.3.1 Two dimensional drawings
Typical examples of two dimensional drawings are as below.
Drawings showing key plan and plan/layout of buildings, facilities and services
Most plants are large enough that a key plan is needed to show where the work will be performed. If there is room on the index sheet, this is a good place to show this information. It is also beneficial to have an overall dimensioned plant drawing, showing how to get to the work area. Major landmarks in the plant should be shown and identified. Many times, this brings up discussions on proximity to high-voltage lines or pipelines, permits required, and the logistics of getting the equipment into the room or the plant. Individual floor plans for respective areas in a plant are also prepared for providing further details of each area.
Drawings with structural design details
These are done on the basis of calculation of member dimensions to examine safe operation of structure. These consist of all the drawings that describe the structural members of the building and their relationship to each other. A set of structural drawings includes foundation plans and details, framing plans and details, wall sections, column and beam details, and other plans, sections, details, and schedules necessary to describe the structural components of the building or structure. The general notes in the structural drawings should also include, when applicable, roof, floor, wind, seismic, and other loads, allowable soil pressure or pile bearing capacity, and allowable stresses of all material used in the design. Please refer to Figure 1.3 for example of a structural drawing.
Machine parts design and fabrication drawings
These are also called machine drawings. These are principally found in and around machine and fabrication shops where the actual machine work is performed. The drawing usually depicts the part or component as an orthographic projection with each view containing the necessary dimensions.
Section drawings
In situations where objects have intricate interior details, and hidden lines do not sufficient clarity, section drawings are used. In such a case the object is imagined being cut or sectioned by planes. The part of the object between the cutting plane and the observer is assumed to be removed and the view is shown in the section drawing. Please refer to Figure 1.4 for example of a section drawing.
Clearance drawings
Clearances are critical for any engineering equipments, parts and modules for the safe and optimum functioning of these parts. These drawings provide details of clearance required while installation/fabrication. Please refer to Figure 1.5 for example of clearance drawing provided for a power module.

Example of structural drawing
Example of section drawing

Example of clearance drawing for a power module

Example of clearance drawing for a transformer
Various types of schematics, wiring diagrams and tables/schedules
Electrical drawings are mostly covered in this category (e.g. motor control schematics, wiring diagrams) and text tables/schedules such as cable schedule, lighting schedule, etc. We shall study these in greater detail in the subsequent chapters.
1.3.2 Three dimensional representations
Three dimensional representations can be further classified as:
Isometric views: In isometric views, all lines on each axis are parallel to each other, and the lines do not converge. Such drawings are commonly used in technical illustrations of:
- Machine parts (please refer to Figure 1.6).
- Exploded views for machine parts where enlarged view of various micro parts are provided (please refer to Figure 1.7)
- Piping schematics and hook-ups.

Example of isometric drawing for a machine part

Example of exploded view for a bearing mounting assembly
Perspective views: A perspective view portrays height, width and depth. This allows the viewer to get a more realistic graphic. All lines in a perspective drawing seem to converge in a vanishing point and the drawn objects appear proportionately smaller with distance. These are used for:
- Displaying architectural views of plants and buildings.
- Computer generated walk through for buildings and architectures.
Solid and surface models: These are used for visualization, analysis and manufacture of complex parts. Typical examples are:
- Wireframe models: these are sculptured models of machine parts. The part is digitized using solid scanning or point to point scanning with a three co-ordinate measuring machine which generates a wire mesh. This wire mesh is further put into CAD for generating a 3D model having geometrical co-ordinates. This 3D model is sent to numerically controlled model making machines for generating the digitized pattern,
- Solid model: is the representation of the solid parts of an object, that is, models of solid objects suitable for computer processing. It is also known as volume modeling A solid model generally consists of a group of features, added one at a time, until the model is complete A solid object is represented by boundary surfaces and then filled to make solid. It is analogous to the process of casting in manufacturing techniques.

Example o f wireframe model and solid model
1.4 Standards in a drawing office
1.4.1 Introduction
The drawing office is considered to be the heart of any engineering organization. Ideas, layouts, schemes and designs worked out by an engineer in the form of a rough sketch, are developed into the drawing stage by stage by the draughtsman. The other departments can do very little within an engineering organization without an approved drawing. The drawing is the universal means of communication.
It is necessary to impose appropriate standards at the drawing stage since all manufacturing instructions originate from this point.
A perfect drawing communicates an exact requirement, or specification which cannot be misinterpreted at a later stage and lead to problems after execution.
Engineering drawings can be produced to a good professional standard if the following points are taken care of:
- Uniformity of graphical depiction is maintained.
- Only necessary information is displayed on the drawings.
- Correct dimensioning is done.
- Only standard symbols and abbreviations are used.
Good communication by the use of drawings of quality relies on ensuring that they confirm to established standards.
1.4.2 Important standards used in drawing office
The standards commonly used by design offices are those shown in Table 1.1.
International standards for drawing office
| Serial Number |
Standard number | Title |
| 1 | ISO 128 | Technical drawings – General principles of presentaton |
| 2 | ISO 129 | Technical drawings – dimensioning |
| 3 | ISO 216 | Paper sizes |
| 4 | ISO 406 | Technical drawings –Tolerancing of linear and angular dimensions |
| 5 | ISO 1101 | Technical drawings – Geometrical tolerancing |
| 6 | ISO 1660 | Technical drawings – Profile dimensioning |
| 7 | ISO 3040 | Technical drawings – Cone dimensioning |
| 8 | ISO 3098/1 | Technical drawings – Lettering |
| 9 | ISO 5455 | Techical drawings – scales |
| 10 | ISO 5459 | Technical drawings – Datum systems for geometric tolerancing |
| 11 | ISO 6410 | Technical drawings – representaion of threaded parts |
| 12 | IEC 60617-2:1996 | Graphical symbols for diagrams. Symbol elements, qualifying symbols and other symbols having general application |
| 13 | IEC 60617-3:1996 | Graphical symbols for diagrams. Conductors and connecting devices |
| 14 | IEC 60617-4:1996 | Graphical symbols for diagrams. Basic passive components |
| 15 | IEC 60617-5:1996 | Graphical symbols for diagrams. Semiconductors and electron tubes |
| 16 | IEC 60617-6:1996 | Graphical symbols for diagrams. Production and conversion of electrical energy |
| 17 | IEC 60617-7:1996 | Graphical symbols for diagrams. Switchgear, controlgear and protective devices |
| 18 | IEC 60617-8:1996 | Graphical symbols for diagrams. Measuring instruments, lamps and signalling device |
| 19 | IEC 60617-9:1996 | Graphical symbols for diagrams. Telecommunications. Switching and peripheral equipment |
| 20 | IEC 60617-10:1996 | Graphical symbols for diagrams. Telecommunications. Transmission |
| 21 | IEC 60617-11:1996 | Graphical symbols for diagrams. Architectural and topographical installation plans and diagrams |
| 22 | IEC 60617-12:1997 | Graphical symbols for diagrams. Binary logic elements |
| 23 | IEC 61082-1:1991 | Preparation of documents used in electrotechnology. General requirements |
| 24 | IEC 61082-2:1993 | Preparation of documents used in electrotechnology. Function-oriented diagram |
| 25 | IEC 61082-3:1993 | Preparation of documents used in eletrotechnology. Connection diagrams, tables |
| 26 | IEC 61082-4:1996 | Preparation of documents used in electrotechnology. Location and installations |
1.4.3 Sizes of drawing sheets
The preferred size of drawing sheets is taken from the ISO-A series which is listed in Table 1.2.
However, under certain circumstances the use of other drawing sheet sizes may be necessary and the ISO-B series sheets may be used. Roll drawings when required should have standard widths of either 86mm or 610mm.
Sizes of drawing sheets (A-Series as per ISO 216)
| Designation | Trimmed size (mm) |
Width of border (mm) |
| A0 | 841 X 1189 | 20 |
| A1 | 594 X 841 | 20 |
| A2 | 420 X 594 | 15 |
| A3 | 297 X 420 | 15 |
| A4 | 210 X 297 | 15 |
1.4.4 Thickness of format lines
Recommended line thicknesses in mm for format lines are as per Table 1.3.
Thickness of format lines
| Feature | A0 Sheet | A1 sheet | A2,3,4 sheet |
| Border lines | 1.4 mm | 1.0 mm | 0.7 mm |
| Title block lines | 1.00 mm | 0.7 mm | 0.5 mm |
| Grid lines | 0.7 mm | 0.5 mm | 0.35 mm |
| Fold lines | 0.25 mm | 0.25 mm | 0.25 mm |
| Other format lines | 0.35 mm | 0.25 mm | 0.18 mm |
1.4.5 Thickness of drawing lines
The thickness of drawing lines is covered in details in the standards and is based on line group types which may be 1.0, 0.7 and 0.5mm (line group 1.0 mm typically used on A0 sheet size) through to 0.35, 0.25 and 0.18 mm (line group 0.35 mm which may be more appropriate for A4 sheets. The standards specifically state that the minimum line thickness on a drawing after reproduction (including reduction) should not be less than 0.18 mm.
1.4.6 Text types and character heights
The following text types are provided in the drawing standards.
- Upright gothic
- Sloping gothic
- ISO 3098/1 Type B Upright
- ISO 3098/1 Type B Sloping
- Micro font
The height of the character should be one of the following (in mm) with minimum character line thickness not less than 10% of the height.
- 2.5 mm
- 3.5 mm
- 5 mm
- 7 mm
- 10 mm
- 14 mm
- 20 mm
The height of the characters should not be less than 1.7 mm on a reduced drawing reproduction.
1.4.7 Ratio of text size to corresponding line thickness
The ratio of line thickness to text size is generally 1:10 and one of the following sets of standard text sizes shown in Tables 1.4 and 1.5 with corresponding line thicknesses are often used.
Text size versus line thickness
| Text size (mm) |
Line Thickness (mm) |
| 1.8 | 0.18 |
| 2.5 | 0.25 |
| 3.5 | 0.35 |
| 5 | 0. 5 |
| 7 | 0.7 |
| 10 | 1.0 |
Text size versus line thickness
| Text size (mm) |
Line Thickness (mm) |
| 2.0 | 0.2 |
| 3.0 | 0.3 |
| 5.0 | 0.5 |
| 7.0 | 0. 7 |
| 10.0 | 1.0 |
| 14.0 | 1.4 |
1.4.8 Units for drawing dimensions
- Imperial units: This unit of measurement is based on feet and inches.
- SI units: This is based on the metric system and all dimensions are measured in millimeters.
Rules for using SI units:
- All fractional values must be preceded by a ‘0’ (for example, 0.14mm).
- Neither comma nor spaces are used for values over 1000.
1.4.9 Drawing scales
All drawings can be classified as either drawings with scale or those not drawn to scale. Drawings without a scale usually are intended to present only functional information about the component or system. Prints drawn to scale allow the Figures to be rendered accurately and precisely. Scale drawings also allow components and systems that are too large to be drawn full size to be drawn in a more convenient and easy to read size. The opposite is also true. A very small component can be scaled up, or enlarged, so that its details can be seen when drawn on paper. Scale drawings usually present the information used to fabricate or construct a component or system.
1.4.10 Use of symbols in drawings
Many engineering devices and components cannot be drawn exactly as they appear physically and hence standard symbols are used to indicate such devices. Symbols should be neatly drawn, taking full advantage of the tools and modes available that ensure accuracy. Straight lines should really be straight, parallel lines should be parallel, square corners should be square, and so forth. Lines should meet neatly at corners, and there should be no stray marks that are part of the blocks.
1.5 Organization of a typical drawing office
The drawing office is a subset of the design office and as such the overall authority resides with the Resident Engineer and the Project manager. Their requirements and decisions are passed on to the drawing office staff via the Chief Draughtsman.
The function of the chief draughtsman is to take overall control of the services provided by the office. The chief draughtsman receives all the work coming into the drawing office which he examines and distributes to the appropriate section leaders. The section leader is responsible for a team of draughtsmen of different grades. When work is completed, the section leader passes the drawings to the checking section after which the standards section scrutinizes the drawings to ensure that the appropriate standards have been incorporated. All schedules, equipment lists and routine clerical work is normally performed by the technical clerk. Completed work for approval is done by the chief draughtsman.
Since the drawings may be produced manually, or by electronic methods, suitable storage, retrieval and duplication arrangements are necessary. Systems in common use include:
- filing by hand into cabinets the original master drawings, in numerical order, for individual components or projects;
- microfilming and the production of microfiche;
- Computer storage.
The structure of a design office is explained in Figure 1.9.

Drawing office structure
1.5.1 Method of work initiation in a design office
No work should commence without a work request carrying the requisite information and signatures in a drawing office. The following information should be completed before commencement of work:
- Name of the person requesting the work.
- Name and signature of engineer authorizing work.
- Respective cost code.
- Date completed for ‘work required by’ field.
- Title of plant or work area.
- Comprehensive work description or title.
- Indicate on the work request information supplied, drawings required.
- Comments or reference
- Date received by drawing office
- Chief Draughtsman signature.
- Draughtsman’s name to whom work is allocated.
1.6 Printing, distribution and control of copies
1.6.1 Sources of work for a design office
Figure 1.10 shows the main sources of work flowing into a typical drawing office. The drawing office provides a service to each of these sources of supply, and the work involved can be classified as below:
- Engineering department: the work would involve development, research, manufacturing techniques, project planning and testing.
- Sales department would require work in connection with general arrangement and outline drawings for tenders; illustrations, chart and graphs; feasibility studies; application and installation diagrams;
- Maintenance and service departments would require work in connection with maintenance tools, service manuals, modification in original design.
- Manufacturing units/project units would require work in connection with component assembly drawings; drawings of tools, jigs and fixtures; plant layout and project execution drawings.

Sources of work in a drawing office
1.6.2 Drawing distribution procedures
A formalized system of drawing approvals must be implemented in any drawing office to define the stage/status of a drawing- the following gives some suggestions as to how this process can be accommodated. A brief description for the drawings issued for various purposes is given below.
1.6.3 Drawings issued for approval
The approval drawing is a scheme, which requires approval from the engineer. These drawings are not to be issued for tender, construction or any consultant or contractor to use as final drawings. After approval of a drawing with all appropriate signatures the drawing need not be issued for reaprroval unless specifically requested on the approval form.
- Approval drawings are for internal use only i.e. client/design department.
- No construction may be carried out using approval drawing.
- Where approval of any drawing is required, it must be issued to the responsible engineer or Manager.
- If a second or third approval is required the drawing must state this.
- Drawing numbers refer to a single drawing or document. Two or more drawings cannot have the same number.
- A duplicate drawing can be issued and stamped accordingly.
- Wherever approval has been sought, the final drawing must state this.
- An approval drawing which has been approved need not be resubmitted.
1.6.4 Drawings issued for final approval
On completion of final drawings and prior to issue, a print shall be made and this shall be handed over to the Project Engineer for his signature and to record that final drawings have been issued to his approval, all previous comments having been acted on to his satisfaction. This shall not be used for further modifications.
1.6.5 Drawings issued for information only
There are a number of situations where a drawing may be issued for information only, i.e. these drawings may be worked to for manufacture or construction.
Drawing may be issued to a contractor for planning his construction program
- Drawings may be issued to a contractor for planning his construction program.
- Drawings may be issued to a supplier to assist in determining type of merchandise best suited to our requirements.
- Drawings may be issued to a Quantity Surveyor for preparation of Bill of Quantities.
1.6.6 Issued for tender
- Drawings shall be as complete as possible before issuing for tender purposes. The more information given at this stage the more accurate the quote and less likely future claim for extras.
- Where possible detail drawings should be sent at tender stage.
- Whenever possible drawings should be checked before going out on tender.
- Tender documents should carry a reference to all drawings, specifications, etc. which form a part of the tender.
1.6.7 Issued for manufacture or construction
- Any variation between drawings at tender stage and construction issue should be highlighted by way of a revision on the drawing.
- When issuing the drawing for construction to the fabricator, issues should also be made to client and a Quality Surveyor also should be involved.
1.6.8 As built
- Represents the final revision to all drawings reflecting actual changes made during the construction and commissioning of the plant.
- Usually forms part of the plant operating and maintenance documentation and must be archived on completion of the project.
1.6.9 Dimensional accuracy
This is of crucial importance. Dimensions must be checked on a local and overall basis. The orientation of each element must be checked in relation to the total unit. In this respect, an orientation diagram must be included on the drawing showing the relevant position of the item in question.
1.6.10 Checking procedures
- Checking procedures fall directly under the control of the Chief Draughtsman.
- The checking activity is the last line of defense in the system to ensure that a drawing represents as closely as possible the functional requirements of the job. As such the checker needs to critically analyze and question any proposals put forward.
- The checker has the right and may challenge, without prejudice any ideas, concepts or formulations that have been committed to paper.
- The checker shall not subscribe to any suggestion until the checker is totally convinced of its usefulness and fitness for purpose.
- No drawing shall be issued for manufacture unless it is authorized by a Checker.
- All drawings produced need to be checked before issue for tender.
- Except under special circumstances, drawings should be checked by an independent department.
A suggested color code for checking
- Red – Incorrect
- Yellow – Correct
- Green – To be used by draughtspersons when correcting errors. Green through red indicating that alteration has been done.
- Should there be revisions to a drawing once it has been signed off as checked then it should be returned for a further check.
- Wherever there is a point of contention between checker and the originating draughtsman, the Chief Draughtsman should be consulted.
1.6.11 Printing of drawings
Printing requirements normally fall into three categories:
- Printing for developing of working drawings
- Printing for issuing internally
- Printing for issuing externally
Procedure for printing, registering and filing:
- All prints should be officially requested.
- Where a job is deemed to be urgent then the Chief Draughtsman must prioritize.
- All other printing should be done on a ‘First come first serve basis’.
- All drawings must be registered in the Master Drawing Register.
- Vendor drawings to be registered with relevant information separately.
- All completed drawings shall be filed in the appropriate place in the filing section – this may be a dedicated location on the server hard disk or a physical location for hard copies.
- A draughtsman should only have in his possession the drawing relevant to the job he is currently working on. All other drawings in his possession should be in the form of prints or microfilm prints and marked accordingly as copies.
1.6.12 Internal drawing release
Procedure for issuing and dispatching of drawings:
- All drawings issued through the Drawing Office/ Printing Section must be formally requested. All drawings issued should be accompanied by a document transmittal form which should be signed and returned and filed by the originator for record purpose.
Control of drawings:
- Controlled Copy of the drawing is released with necessary information mentioned in a format called ‘Change Notice’ and distributed to the concerned department.
- Change notice format contains all information like the number of changes, issue level, reason for change, further course of action(on the previous level component) and also indicates the distribution list.
- Change notice is issued along with a change notice return slip. The user of the drawing returns the change notice return slip to the originator indicating that the old level drawing has been destroyed.
1.6.13 Managing multiple copies
- Based on the change request from other department the drawing is updated and released with next change level to the concerned department.
- Old and new drawings are maintained in the respective files.
- Multiple copy drawings are issued only to certain departments like Purchase where there is a possibility to issue the drawings to various suppliers for different reasons.
- The change notice contains information about the number of copies distributed and it is then the responsibility of the concerned department to control these drawings.
- Additional copies are issued only on request and are properly controlled.
1.6.14 Use of CAD and management of CAD drawings
With the introduction of computer-aided drafting (commonly called CAD) there is a totally new dimension in the use and management of drawings. The ease of sharing, using a single drawing to represent different aspects of engineering and displaying them selectively and possibilities for on-screen reviews and in many cases distribution of drawings on-line have changed the way of generating, managing and distributing drawings. We will review these under a separate chapter in greater detail later. Some of the salient features of CAD drawing management are as follows:
- Drawings are controlled in a central area of the CAD system called as Archive.
- Drawings in the archive can be viewed by user having access to the CAD system.
- Drawings while under creation should be kept in the private area and should be placed in the central archive only after proper approvals.
- Drawings can be removed from the archive for changes as per the process and can be placed back in the archive with the next level of change.
1.7 Summary
Engineers and technical personnel associated with an engineering organization use drawings to convey graphically the ideas and plan necessary for execution and completion of a project involving construction or assembly of components or systems.
Drawings work as a tool for problem solving at various stages of working in an organization. The drawings are at the centre of activities taking place in an engineering organization whether a manufacturing organization or a turnkey contracting organization.
The different parts of the world started forming their own electro-technical societies in the nineteenth century as the need aroused for development of standards for the engineering processes. Two of the oldest electro-technical institutions that came into being were the American Institute of Electrical Engineers (IEEE) and the International Electro-technical Commission. These institutions have developed electro-technical standards which have benefited both the manufacturers and the users immensely. Some of the other important societies/standards related to the field of electrical engineering are NEC, NEMA and VDE.
Technical drawings are used to convey a large amount of exact, detailed information in an abbreviated language. They consist of lines, symbols, dimensions, and notations to accurately convey an engineer’s designs to electricians/technicians who install the electrical system on a job. Some of the types of electrical drawings used for any project can be categorized as block diagrams, layout drawings, single line diagrams, wiring diagrams etc. All drawings should be prepared in line with the international standards mentioned above or any company specific standards.
The drawing office is a subset of the design and as such the overall authority resides with the Resident Engineer and the Project manager. Their requirements and decisions are passed on to the drawing office staff via the Chief Draughtsman. The function of the Chief Draughtsman is to take overall control of the services provided by the office. The Chief Draughtsman receives all the work coming into the drawing office which he examines and distributes to the appropriate section leaders. The section leader is responsible for a team of draughtsmen of different grades. When work is completed, the section leader then passes the drawings to the checking section. After the checking drawings are printed and released as per the prevalent standards of the company.
2
Components of a Drawing, Drawing Sizes and Scales
This chapter explains the various components of a drawing, the common information recorded on drawing and some simple rules pertaining to creation of engineering drawings. It also explains the procedures for planning the layout of a drawing and the concepts of scales, grid referencing and revision marking for drawings.
Learning objectives
- To familiarize the reader with the common information recorded on an engineering drawing and the features of an engineering drawing
- To familiarize the reader with the different sizes, scales, layouts and revision marking standards for engineering drawings
2.1 Typical engineering drawings
What is a typical engineering drawing made up of? A typical engineering drawing is made up of the following (please refer to Figure 2.1):

Layout of a typical engineering drawing
2.1.1 Margin
Margin is provided in the drawing sheet by drawing margin lines. Prints are trimmed along these lines. After trimming, the prints would be of the recommended sizes of the trimmed sheets.
2.1.2 Border lines
Clear working space is obtained by drawing border lines as shown in Figure 2.2. A border of 20 mm width should be provided for sizes A0 and A1. For sizes A2, A3 and A4 a border of 10 mm should be provided.
2.1.3 Orientation mark
Four centering marks are drawn to facilitate positioning of the drawing for the reproduction purpose.
2.1.4 Frame
Frame shows the clear space available for the drawing purpose and contains the drawing along with the title block, legend block, bill of materials block, notes block and the revision block.
2.1.5 Grid reference system
Drawings can be large and complex and finding a specific point or piece of equipment on the drawing can be quite difficult. This is especially true when one wire, cable rack or pipe run is continued on a second drawing. To help locate a specific point on a referenced print most drawings have a grid system. Like a city map, the drawing is divided into smaller blocks, each having a unique identifier (please refer to Figure 2.2).
Vertical grid lines have designators shown as grid numbers from left to right. Horizontal grid lines have designators alphabetized from bottom to top or in some cases from top to bottom. To eliminate confusion with the numbers ‘0’(zero) and ‘1’(one), letters “O” and “I” are usually avoided.

Grid system on an engineering drawing
2.1.6 North symbol and key plan
A north symbol showing north direction is usually provided on all plan drawings (please refer to Figure 2.3).
A small key plan is usually provided wherever a partial plan is shown. On the key plan, location of the partial plan must be shown. Partial plan and key plan must be oriented identically. Please refer to Figure 2.4.

North sign on an engineering drawing

Key plan on an engineering drawing
2.2 Various categories of electrical drawings
2.2.1 Preliminary drawings
These drawings are prepared during the initial design and engineering stage of a project.
Block Diagram
A block diagram is a simple diagram in which an installation or equipment system together with its functional relationships is represented by block symbols or outlines with annotations without necessarily showing connections. Block diagrams are used in conjunction with text material. They are used to present a general description of a system and its functions.
A block diagram provides the following:
- It helps identify the boundaries of a system.
- It helps identify the input and output for each component.
- Helps identify the relationship between the components.
Key single line diagram
During the preliminary project designing of any project, the key diagram used is the single line diagram (SLD) also called the one line diagram and a number of subsidiary single line diagrams. The set of single line diagrams form the basis of all electrical work carried out in a project. The SLD shows all pertinent information about the sequence of the circuit, but does not give as much detail as a schematic diagram. Normally, the SLD is used to show highly complex systems without showing the actual physical connections between components and individual conductors. The purpose of the single line diagram is to show sources of power, electrical equipments, electrical drives, system details and fault levels.
2.2.2 Detail drawings
These drawings are prepared during the later stages of design and engineering of a project. Type of drawings in this category are as listed below.
Layout drawings for individual electrical systems
A layout drawing by the designer is an exact graphical representation of the layout of the various fixtures, equipments, utilities and buildings of the plant. It is intended for engineering and calculation of bill of materials in the first phase and for the execution phase at the later stage. The layout is a key drawing from which detailed drawings are made. Electrical layouts usually include:
- Lighting layout
- Switchgear layout.
- Generator and other equipment layout.
- Earthing layout
- Lightening protection system layout.
- Cable layout
- Conduit layout
- Cable tray layout.
Area classification drawings
These are especially relevant for the refineries, chemical plants, oil depots, boosting areas, tank farms, delivery facilities and terminals. If the new installation will reside in, or the cables route through, any electrically classified area, this drawing must be provided as well. Hazardous areas have special requirements for electrical fixtures and wiring.
Specification sheets for electrical equipments
The purpose of preparing a specification sheet is to ensure that the vendor provides equipment exactly as per the requirements of the purchaser. Since the requirements of the purchaser vary from project to project depending upon the system requirements and geographical conditions, specification sheet helps reduce technical ambiguities and system malfunctioning at a later stage.
Wiring Diagram
A wiring diagram is a comprehensive diagram of each electrical circuit system showing all the connectors, wiring, terminal boards, signal connections (buses) between the devices and electrical or electronic components of the circuit. It also identifies the wires by wire numbers or color coding. Wiring diagrams are necessary to troubleshoot and fix electrical or electronic circuits
Panel schedules and load list
Panel schedules are essential for showing all of the small and major electrical equipments in the system. The panel schedule drawing contains a tally that shows the expected amount of volt-ampere usage for each circuit and the overall expected connected load for each phase on the panel. This helps ensure that the load is evenly distributed between the phases, and that the panel is balanced. The load list provides information on the device power requirement.
Logic diagrams
The use of logic symbology results in a diagram that allows the user to determine the operation of a given component or system as the various input signals change. Detailed logic diagrams show all logic functions of the equipment concerned. In addition, they also include such information as socket locations, pin numbers, and test points to help in troubleshooting.
2.3 Planning your drawing
2.3.1 Paper sizes for engineering drawing
The metric standard for the drawing sheet sizes starts at A4 and is 210 X 297 mm. This size is doubled 4 times to create 5 sizes up to A0 which is a rectangle of one square meter in area, the sides of which are in the ratio √2:1. Since the size of the divided sheets are always in the same √2:1 ratio, drawings can be enlarged or reduced to fit exactly into any of these sizes. Please refer to Figure 2.5 for metric drawing sheet sizes.

Drawing sheet sizes as per metric standards
2.3.2 Recommended sheet sizes versus drawing types
Many companies have established in-house standards regarding a variety of drawing areas not covered by ISO standards. A typical recommendation of drawing sheet size versus drawing type is shown in Table 2.1. It has to be borne in mind that the reduction of drawing size when reproducing large drawings must not allow the line thickness or character heights to fall below the values stated in the standards for legibility. Reduction of more than two drawing sizes will in nearly all cases make portions of drawings illegible.
Recommended sheet sizes versus drawing type
| Document type | Drawing size |
| Block diagram | A4 |
| Specification sheets | A4 |
| Cable/Lighting schedules | A4 |
| Single Line Diagrams | A1/A4 |
| Electrical schematics | A1 |
| Inteconnection diagrams | A1 |
2.3.3 Planning a drawing
Here are some general guidelines for planning a drawing:
- Before starting your engineering drawing you should plan how you are going to make best use of the space. It is important to think about the number of views your drawing will have and how much space you will use of the paper.
- Try to make maximum use of the available space.
- If a view has lots of detail, try and make that view as large as possible. If necessary, draw that view on a separate sheet.
- If you intend to add dimensions to the drawing, remember to leave enough space around the drawing for them to be added later.
- If you are working with ink on film, plan the order in which you are drawing the lines. For example you don’t want to have to place your ruler on wet ink.
2.3.4 Arrangement
The title block of a drawing should come at the lower right hand corner of the drawing and the notes area should appear either above the title block or at the left of the title block as shown in Figure 2.6. Further the drawing could be printed with the portrait or landscape orientation depending on the layout requirements.
Drawing area arrangement
2.3.5 Single and multi sheet drawings
Quite often the layout of a drawing is large and cannot be accommodated on a single sheet and part of the drawing is carried on to the next sheet. All sheets have the same drawing number but different sheet number and reference is made to the previous drawing through a match line. Also insert sheets are used to provide details of a particular section on a separate drawing. Refer to Figure 2.7 for example of a match line and Figure 2.8 for an insert sheet.

Multisheet drawing
Another application of multi-sheet drawings is in the case of electrical schematics for Control Panels and LV/MV switchgear assembly drawing which run into several pages for providing the following details:
- Title Sheet
- General arrangement
- Single Line Diagram
- Wiring diagram
- Control circuit details
- Terminal block details and cable termination/tag details
Cross-referencing between the different sheets is required while co-relating the operation of the various components such as relays (actuating coil details are shown in the power circuit and the contact details are shown on different sheet in the control circuits.). We shall study more of these in detail in Chapter 5.

Multisheet drawing with same horizontal grid numbers
2.3.6 Use of drawing scales
Drawing scale is expressed as a ratio of drawing unit: real world unit. Commonly used scales for the metric standard are shown in Table 2.2.
Drawing scales
| Scale type | Scale Ratio |
| Enlargement Scale |
50:1 20:1 10:1 5:1 2:1 |
| Full size Reduction Scale |
1:1 1:10 1:100 1:1000 1:2 1:20 1:200 1:2000 1:5 1:50 1:500 1:5000 |
Scales other than mentioned above should be avoided. It should always be expressed in round Figures and not numbers such as 1:237. Check that the scale printed on the drawing is mentioned correctly. Enlarged sections should be used to show congested areas.
Certain drawings such as wiring diagrams, block diagrams etc are not drawn to scale. Similarly certain details are also not drawn to scale. In such cases it should be explicitly specified “Scale: None” or N.T.S. (refer to Figure 2.9).
Detail not to scale
2.3.7 Multi-scale drawings
Multi-scale drawings are used where the whole drawing cannot be prepared using a single scale as several details require enlargements/blow-ups. For example, in a floor plan drawing one needs to show an overall floor plan and also an enlarged plan. In such cases, another drawing should be created at the correct scale and reference in the portions for the other drawing should be indicated. Layouts should not be forced into one page but rather on different pages with different scales.
Another example for the use of multi-scale drawings is a plan or layout drawing, where the main drawing is shown on a different scale and the key plan (usually provided on the top right hand corner) is provided with a different scale (is more diminished than the main drawing). Please refer to Figure 2.10.

Partial floor plan with key plan (Multiscale drawing example – 1)
Also machine drawings have sections shown with different scale and the main drawing with a different scale for the purpose of showing enlarged views of the sections. Please refer to Figure 2.11 which shows a multi-scale machine drawing; the main drawing uses a scale of 1:1 whereas the section drawing uses a scale of 5:1.
Machine part drawing with section details (Multiscale drawing example – 2)
2.4 Title block in a drawing and what it should contain
A title block is an essential part of any technical drawing. It contains all the necessary information required to identify and authorize a drawing. It is usually located on the bottom or lower right hand corner of the drawing. The kind of information contained within the title block varies with the requirement drawing and the kind of people who will be using the drawing. The range of information usually includes:
- Title
- Description
- Drawing reference number
- Client logo
- Company logo
- Project title
- Drawing date
- Issue date
- Authorization date
- Scale
- Drafter’s initials
- Checker’s initials
- Authorizer’s initials
Please refer to Figure 2.12 which shows an example of title block.
2.4.1 First area of the title block
The first area of the title block contains the drawing title, description, drawing reference number, client logo, company logo and project title. The drawing title and drawing number are used for identification and filing purposes. The number is unique to the drawing and comprises of a code which contains information about the project and the type of drawing. The drawing number also contains information about the sheet number and revision level.
2.4.2 Second area of the title block
The second area of the title block contains the signature and the approval dates, which provide information as to when and by whom the component/system was designed and when and by whom the drawing was drafted and verified for final approval. This information can be utilized for locating further information on design or operation. This information also helps in resolving technical discrepancies. Refer to Figure 2.13 for example of approval section of the title block.

Title block of a typical engineering drawing

Approval section in the title block
2.4.3 Third area of the title block
The third area of the title block is the reference block. The reference block lists other drawings that are related to the system/component and it also lists all the other drawings that are cross referenced in the particular drawing depending on the company’s conventions. The reference block can be extremely helpful in tracing down additional information on the system or component. Refer to Figure 2.14 and 2.15 for examples of reference section of the title block.

Reference section in the title block (example – 1)

Reference section in the title block (example – 2)
2.5 Legend block
Drawings comprise of symbols and lines that represent components or systems. Although most of the symbols and lines are standard or self-explanatory, most of the drawings are provided with a legend block which explains the conventions used in the drawing. The legend block should always be referred while studying any drawing. Figure 2.16 shows an example of the legend block.

Legend block
2.6 Bill of materials block
A bill of materials is the list of components that are needed for the construction of the assembly; design of which has been provided in the drawing. Examples of bill of material block are shown in Figures 2.17 and 2.18.

Bill of material block (example – 1)

Bill of material block (example – 2)
Sometimes the bill of materials block and the legend block is combined so that a single block is used to represent the legend as well as the quantities.
2.7 Drawing notes block
The notes section specifies details or information which the designer thinks would be necessary for interpreting the drawing correctly.
Notes are of the following types:
2.7.1 Keyed notes
These are used wherever space is limited in the drawing field. These are usually shown below the general notes. Keyed notes are numbered starting from the number one. Refer to Figure 2.19 for an example of keyed notes.

Keyed notes
2.7.2 General notes
These are general information pertaining to the drawing. Please refer to Figure 2.20.

General notes
2.7.3 Special notations
These are usually used for information pertaining release and control of drawings. Please refer to Figure 2.21.

Special notations block
2.8 Revision history, revision numbering and use of revision marks
The revision history block shows the following information in the chronological order:
- Revision number (usually given as 0,1,2,3..or A, B,C…)
- Sheet number
- Zone
- Item
- Description providing reason and nature of revision
- Date
- Initials/Signature
Figure 2.22 shows the typical revision history block provided in a drawing.

Revision block
2.8.1 Revision numbering
As changes to a component or system are made, the drawings depicting the system must be redrafted, updated and reissued. When a drawing is first issued it is given a revision ‘0’ or (-) and the revision block is empty. As each revision is made in the drawing, an entry is placed in the revision block. The entry provides details of the revision number, date and the brief description and nature of change. As the system is modified, and the drawing is revised to reflect the changes, the revision number is increased by one and the revision number is updated in the revision block e.g. if a Revision 1 drawing is revised the old drawing will continue to exist as Revision 1 but a new modified drawing will be released with the required modifications as Revision 2.

Revision number
2.8.2 Use of revision marks
There are two common methods of indicating where a revision has changed the contents of a diagram. The first is the cloud method where each change has a hand drawn cloud shape as shown in Figure 2.24.

Revision cloud
The second method involves placing a triangle mark as shown in the Figure 2.25 below. The cloud method is used for indicating the most recent change while the triangle method is used to indicate all revisions to the drawing. All previous revisions are shown with the help of triangles.

Revision triangle
2.9 Summary
The major components of an engineering drawing are the title block, legend block, bill of material block, notes block and the revision block.
A title block is an essential part of any technical drawing. It contains all the necessary information required to identify and authorize a drawing. It is usually located on the bottom or lower right hand corner of the drawing. Most of the drawings are provided with a legend block which explains the conventions used in the drawing. The legend block should always be referred while studying any drawing. The Bill of materials is the list of components that are needed for the construction of the assembly, design of which has been provided in the drawing. The notes section specifies details or information which the designer thinks would be necessary for interpreting the drawing correctly. The revision block provides details about the revision history of a drawing.
To help locate a specific point on a referenced print most drawings have a grid system. Like a city map, the drawing is divided into smaller blocks, each having a unique identifier.
Drawing scale is expressed as a ratio of drawing unit: real world unit. Certain drawings such as wiring diagrams, block diagrams etc are not drawn to scale. Similarly certain details are also not drawn to scale. In such cases it should be explicitly specified “Scale: None”. Multi-scale drawings are used where the whole drawing cannot be prepared using a single scale as several details require enlargements/blow-ups.
3
Symbols Used in Electro-technology and Governing Standards
The chapter explains the necessity of development of worldwide standards for drawing symbols. The chapter also explains the necessity of development of company specific standards and the requirement of non-standard symbols by drawing offices.
Learning objectives
- To familiarize the readers with the symbols used for drawings in electro-technology as per international standards and also the common conventions for use of line types for various purposes and services.
- To explain the need for development of company specific standards and the necessity of use of non-standard symbols at times.
3.1 Types of drawings that need symbols
The electro-technical field is the largest branch of engineering and continues to grow. This dynamically changing field interfaces with architectural, civil, mechanical, industrial and computer and many other disciplines of engineering. A common, seamless and interrelated graphics language is needed to prepare drawings and diagrams which can be used by engineering design groups of various disciplines. Drawing symbols play a key role in the development and maintenance of the drawings. A primary consideration for any organization is the consistent interpretation of drawing symbols to ensure safe and efficient operation, maintenance and engineering. Since the symbols are the alphabets or basic components of engineering graphics, the reader has to be very well versed in what the various symbols portray. These typical symbols are used so frequently in drawings that their meanings must be familiar not only to the preparer, but to the user as well.
The need for development of standard symbols and symbology in the engineering industry can be attributed to the following factors:
- Standardization of symbols makes plans and drawings more encrypted but easily understandable.
- Symbols allow the technical information to be presented with a high level of accuracy and brevity. Because of small scales used in drawings, standard symbols are used to present complete information regarding the items and materials used.
- Symbols permit consistency in the way dimensions and tolerances are specified. Each symbol signifies what it stands for.
- Electro-technology uses a wide range of devices and to provide pictorial for these devices is almost impossible and the same is achieved very conveniently through use of symbols.
- Use of symbols saves designers and draughtsman a lot of time.
- With globalization in industry, a particular drawing can be referred by engineers of various countries because components of a device may be manufactured in one country, assembled in another country, installed, commissioned and serviced yet in a third country. In such a scenario, it is important that the design should use a language based on standard symbols universally acceptable.
The need for symbology for the various types of drawings in electro-technology are discussed below:
- Block Diagrams and Flow Diagrams: These do not require any special symbols and can be represented through text and boxes.
- General Arrangement Drawings of Control Panels and Switchgear Assemblies: Symbols pertaining to dimensioning and units are required.
- Floor Plan and Layout Drawings: Symbols pertaining to dimensioning and units are required in particular as these drawings are mostly scale drawings.
- Foundation Plans for heavy electrical equipments: Standard symbols pertaining to civil and structural engineering are used.
- Single Line Diagrams, Wiring Diagrams and Electrical Schematics: These drawings are schematic representation of electrical circuits and therefore have no scale or dimensional markings but solely depend upon the electrical drawing symbology. Electrical devices are too complicated to be represented pictorially without the use of symbols. Symbols are used for representing devices and electrical wiring by appropriate lines.
- Logic Diagrams: These are based on standard symbols and notes for logic gates.
To summarize it may be mentioned that all drawings require some kind of symbol or the other for an accurate representation of the design. Some of the general symbols used for drawings are mentioned in Figure 3.1.

General symbols
Dimensioning is an important aspect of the General Arrangement and Plan Drawings. The anatomy of dimensioning is explained in Figure 3.2.
Dimensioning in drawings
3.2 Symbols as per electro-technology standards
Regardless of the drawing standards adopted by a company, a consistent use of same set of symbols throughout a project is essential for both clarity of the component and as well as efficiency in production of large number of drawings. Symbol libraries for CAD software are readily available from many software companies based on the IEC/IEEE standards. Abbreviations, letter symbols and component symbols used in electro-technology as per IEC/IEEE standards are mentioned in the tables below.
3.2.1 Letter symbols for numbering of electrical units as per IEC
Components of an electrical circuit are numbered by means of a single alpha character combined with a sequential digit each time a new component is used (e.g. transformers may be numbered as T1, T2, etc.). The standards for the alpha character may vary from company to company and it is normal to draw a legend sheet to explain the use on a particular set of drawings. Table 3.1 broadly coincides with the recommendations of IEC standards for letter designations for electrical units.
Letter symbols for numbering of electrical units
| Letter Code | Type | Examples |
| A | Assemblies, subassemblies | Amplifier with transistors, magnetic amp, laser |
| B | Transducers, from mechanical to electrical and vice versa | Thermo electric sensor, transducer, loudspeaker |
| C | Capacitors | |
| D | Delay/storage devices | Bi-stable, monostable, register |
| E | Miscellaneous | Lighting and heating devices |
| F | Protective devices | Fuse, arrestor |
| G | Generators, supplies | Battery, supply device |
| H | Signaling devices | Optical and acoustic indicators |
| J | ||
| K | Relays, contactors | |
| L | Inductors | Induction coil, line trap |
| M | Motors | |
| N | Amplifier, regulator | |
| P | Measuring/test equipment | Indicating, recording devices |
| Q | Mechanical switching devices | Circuit breaker/isolator |
| R | Resistors | Potentiometer, rheostat, shunt |
| S | Switches, selectors | Pushbutton, limit, selector |
| T | Transformers | Voltage, current transformer |
| U | Modulators, changers | |
| V | Tubes, semiconductors | Diode, transistor |
| W | Transmission paths, waveguides, aerials | Jumper wire, cable, busbar, dipole |
| X | Terminals, plugs, sockets | |
| Y | Electrically operated mechanical devices | Brake, clutch |
| Z | Terminations, hybrid transformers, filters, equalizers |
3.2.2 Electrical drawing symbols as per IEC
The symbols used for representing various electrical components and devices for use in electrical drawings as per IEC is provided in Table 3.2.
IEC Switch Notation

IEC does not have a notation for selector switches. Many utilities and manufacturers use the following symbols:

Electrical symbols as per IEC or IEEE


3.2.3 Some other commonly used symbols in electro-technology
Some of the other commonly used symbols in electro-technology are shown in Figure 3.3.

Commonly used symbols in electro-technology
3.2.4 Symbols for protection functions and measurement/ monitoring functions
IEC provides numbers for electrical device identification. It is a general practice to use these numbers in electrical drawings especially for the protective devices such as relays. The complete list of device numbers is provided in Chapter 4 (Table 4.3). Some of the commonly used symbols in electro-technology for protection functions and measurement/monitoring functions are mentioned in Table 3.3 and Table 3.4 respectively.
Protection functions for relays
| IEEE number | Function name |
| 50/51 | Overcurrent protection |
| 50N/51N | Earth fault protection |
| 67N | Directional earth fault protection |
| REF | Restricted earth fault protection |
| 46 | Broken conductor protection |
| 46 | Unbalance protection |
| 47 | Phase reversal protection |
| 48 | Stall protection |
| 66 | Frequent start protection |
| 37 | Undercurrent protection |
| 49 | Overload protection |
| 32 | Reverse power, 1 phase |
| 59N | Residual voltage protection |
| 59 | Overvoltage protection, 1 phase |
| 27 | Undervoltage protection, 1phase |
| 79 | Autoreclose function |
| 50BF | Circuit breaker failure protection |
Measurement and monitoring functions
| IEC symbol | Function name |
| 3I | Three-phase current |
| Io | Neutral current |
| IL | Average and maximum demand current |
| ULI/U12 | Phase to earth and phase to phase voltage |
| P | Active power |
| Q | Reactive power |
| S | Apparent power |
| PF | Power factor |
| F | System frequency |
3.3 Use of non standard symbols
Sometimes a symbol for a particular component or device may have been created by the engineer who developed the drawing. Some of the symbols on a drawing may not be standard. The need for developing custom made symbols comes up because there are numerous components and devices for which standard symbols are not available and are needed to be used by the designers frequently. In such a case organizations develop their own library of custom-made symbols which helps them maintain consistency both while working within the organization as well as while interacting with their vendors. The library of custom made symbols is passed on to the vendors so that they can use consistent symbols while making the vendor drawings.
Some of the old organizations also have old drawings which were prepared prior to the process of standardization. Often the non-standard symbols in those drawings are retained for use by the operation and maintenance personnel.
The legend on a drawing should clearly show any non-standard symbols and their meanings.
3.4 Use of color and line types in representing various services
Lines are the backbones of engineering drawings. The line types used for dimensional drawings, General Arrangement drawings and layout drawings are shown in Figure 3.4.

Line types and widths
The line types use for representing various services are shown in Figure 3.5.

Line types for services
The line types used for showing various types of electrical wirings are shown in Figure 3.6.

Line types for wiring
3.4.1 Use of colors in electrical diagrams
Use of different colors in electrical diagrams is a part of the visualization techniques adopted by engineers for providing vital inputs to the operators. Colors are used in mimic diagrams which are representations of the substation/plant systems and enable the operator to view the whole system from one place only. The mimic helps in identification of exact location of faults at working on the moment it occurs. Electrical mimic diagrams are used in power plants, petro-chemical plants and refineries, cement plants, iron and steel plants etc. In a power plant for example different colors are used for indicating different voltage levels in the single line and bus diagram mimics (in a particular case for example, 800kV network is shown in yellow, 400 kV network is shown in red, 220 kV network is shown in green. HVDC is shown using the violet color and other colors are used for lower voltage level networks). By use of different colors for various services/voltage levels, information is presented to the operator in a meaningful way, which facilitates easy comprehension, assimilation of the existing situation and quick response to an emergency situation.
3.5 Company standards for drawings
The international standards provide the framework for building the organization’s quality management systems. This framework provides guidelines and structures for creating, implementing and managing the quality management system, but of itself is not the whole system. It is a generic system which when properly implemented together with an organization’ specific business standards, can place the organization in a more competitive position. Every engineering organization has specific process requirements and only the organization has the adequate experience and knowledge to develop standards which are specific to their requirement. By developing company standards for the various departments, an organization can achieve greater accuracy and efficiency in its working. Also the development of company standards involves the participation of employees at various levels making the standards easily adaptable. The integration of the standards with the existing system becomes much easier. The standards can also be revised and updated easily.
The amount of information exchanged in today’s world is greater than ever before and rapidly changing technology drives the exchange of design information and data for highly complex, specialized and or custom made items. This exchange of information relies heavily on engineering drawings, and this reliance mandates the need for specific company standards for drawings.
3.6 Summary
To summarize it may be mentioned that all drawings require some kind of symbol or other for an accurate representation of the design. It is necessary for all engineering organizations to have a library of symbols as per the ISO/IEEE/IEC standards. Companies may use non standard symbols also depending upon their specific requirements and it is also necessary for the organizations to have their own design standards for drawings in addition to the international standards.
4
Single Line and Three Line Diagrams
This chapter explains the purpose and applications of electrical line diagrams. It explains the conventions and symbols used in line diagrams and provides examples and practical lessons for reading and interpretation of single line diagrams.
Learning objectives
- To familiarize the reader with the purpose and application of one line and three line diagrams.
- To familiarize the readers with the techniques for preparation, reading and interpretation of single line diagrams with the help of practical examples and questionnaires.
4.1 Purpose
4.1.1 What is a single line diagram?
A single line diagram (SLD), also sometimes called a one-line diagram, is a drawing that shows by single lines and symbols a simplified layout of a three-phase electrical system. It is a schematic drawing of an electrical power system that uses a concise, standard notation accepted by all power engineers. Single line or one-line diagrams get their name from the fact that only one phase of a three-phase system is shown and only one line is used to represent any number of current carrying conductors. Standard symbols are used to represent components of power systems, such as transformers, circuit breakers, generators, fuses and switches.
4.1.2 Why single line is used to represent all the 3 phases
The transmission system is a three-phase network, i.e. the power is transmitted to the load centers through three energy conductors. However considering normal operation conditions, these three phases are projected to be electrically balanced i.e. they have similar electric connections. Thus, it suffices to represent the system using only the connections of one of these phases. In this context, single line diagrams comprise the one-phase graphical representation of the network element connections, such as transmission lines, transformers, generators, loads, substations, switching devices etc. They usually provide an adequate way to get an overview of the network giving the designer/engineer a reasonable idea of the service reliability.
4.1.3 Why is it important?
- It is the basic and the most important diagram for any power distribution system as it provides the information for power flow from the incomer to the outgoings.
- The single line diagram is the most important drawing that a plant can have for understanding its power system. If properly drawn, it shows a correct power distribution path from incoming power source to each downstream load – including the ratings and sizes of each piece of electrical equipment, their circuit conductors, and their protective devices.
- It provides complete information of all components attached to the power circuit of any system.
- It is a fundamental tool for understanding and evaluating the electrical distribution system.
- It illustrates the interconnection of the electrical system.
- It is a required first step for system analysis and future changes.
4.1.4 Information provided in a single line diagram
A single line diagram must incorporate the following information as a minimum.
- GENERAL:
- Marking of phase-lines on incoming circuit/bus-bars/feeders
- Cubicle No./Circuit No. marking
- Legend/Legend drawing reference
- Board designations
- Device designations
- INCOMING CIRCUIT/SECTIONALISING CIRCUITS
- Incoming cable size/source details marked
- If through bus-duct, symbol and ratings marked
- Type of switching device and nominal rating
- CT/PT ratio, burden and accuracy class
- Instruments
- Relays (represented using ANSI/IEC convention)
- Earthing of incoming/outgoing feeders
- Surge arrestors for incoming feeders
- TRANSFORMERS
- Rating, connection, vector group, voltage ratio and percentage impedance
- Transformer alarm and protections
- Tap changer provision and range
- Neutral earthing
- CT/PT ratio, VA, accuracy class
- Relaying details
- BUS-BARS
- Nominal supply voltage/frequency with tolerances
- Nominal current/short time current ratings
- No. Of phases + neutral
- System specification (BIL, earthing type etc.)
- Bus PT (ratio, burden, accuracy class)
- Instruments and ranges
- Relaying
- Earthing provision for bus-bars
- Surge suppressor for buses
- Interconnecting bus-duct
- FEEDERS
- No. of feeders including spares and description
- Ratings of switching elements and protective elements
- CT/PT, ratio, class of accuracy, VA
- Protections Relay type and setting range
- Instruments and ranges
- Cable sizes
- Earthing provision
4.1.5 Advantages of a single line diagram
- It requires much less space and hence leaves room for the designer for providing other useful information in the drawing.
- It is simple and hence requires much lesser time for the reader to understand the basic system design.
- It is very versatile and comprehensive because it can depict very simple DC circuits, or a very complicated three-phase system.
4.2 Typical examples
Some typical examples for single line diagrams are given below:
Figure 4.1 shows the power distribution system in a plant with 13.8 kV incomers. Voltage and current transformers are provided with relays for protection and metering. Voltage is stepped down to 480 Volts through 1000 kVA transformers through ACB of 1200 Amps. Output from the transformers is fed to the medium voltage switchgear with outgoing feeders for large motors and auxiliary transformers/ other distribution boards. Power from the MV switchboard is further step down transformers for lighting and control supply. The MV switchboard also has a bus-coupler of 1200 Amp for coupling of the two incomers.
Figure 4.2: shows the preliminary power generation and distribution scheme in a generating plant with two numbers of alternators at generating voltage of 4.16 kV, two numbers of step-up transformers in the sub-station step-up the voltage for further distribution and transmission. One of the transformers supply is utilized for Feeder-1 and Feeder-2 details of which are provided in other drawings. The output from the other transformer is taken for utilization through the step-down sub-station at 4.16 kV. Power from this sub-station is further taken load-center stepdown sub-station which steps down the voltage to 480 V for utilization for the motors, lighting and other utilities through metal clad low voltage switchgear.
Figure 4.3 shows the single line for a 27187 kVA, 11kV generator. The drawing shows the details of the line cubicle, neutral cubicle, AVR, neutral earthing resistor cubicle.
Figure 4.4: shows the power flow in a manufacturing plant where power is received through overhead line 22kV. Switching is provided through the double-pole (DP) structure and CT/PT metering section is provided. The HT panel consisting of 400 amp incomer feeds the power to two circuits one of which is utilized for the existing plant and the other is utilized by the new plant. The power through the 400 Amp VCB is stepped down by the outdoor transformer for utilization through the PMCC. The PMCC also receives power from the DG through the DG control panel. An interlock system between the two incomers and the bus-coupler is provided. Outgoings from the PMCC are utilized for various load centers. Power factor improvement is achieved through the capacitor banks of the PMCC.

Single line diagram

Single line diagram

Single line diagram

Single line diagram
4.3 The differences between single line and the 3-line diagram
We have studied about the purpose and the information contained in single line diagram in the above section. Single Line diagrams provide a basic roadmap to the interconnections of the electrical system, and serve as a building block from which all types of system analyses are based. It gives us a basic understanding of the functions of the components of a system.
The 3-line diagram shows the different components of the circuit as simplified standard symbols, and the power and signal connections between the devices. Arrangement of the component interconnections on the diagram does not correspond to their physical locations in the finished device. Figure 4.5 shows a simple 3-line diagram for a motor DOL starter.
We shall study more examples in details for 3-line diagrams in Chapter 5.

Example of 3-line diagram
Differences between one-line and 3-line diagram
| One-line diagram | Three-line diagram |
| Single Line diagrams provide a basic roadmap to the interconnections of the electrical system, and serve as a building block from which all types of system analyses are based. | These are prepared as a result of further working on the basis of single line diagrams as they provide details for electrical wiring connections. |
| Is a part of the initial plant electrical design. Is usually a part of the initial tender document. Is mainly used for working out panel schedules, load schedules, fault analysis, protection system design |
Is a part of the detailed design document. Is prepared ususally after the tendering stage i.e. before manufacture. Used for control designing ciruit diagrams, control circuits, phase sequencing, differential relay settings, metering transformer connections, etc. |
| A single line diagram is a simplified notation for representing a three-phase power system. Since the loads on the three phases are identical , any one phase can be used for representing either of the phases | Here all three conductors of the three phase system are shown individually. Details of the power and the control circuits are also shown as per actual field connections. |
4.4 Applications
4.4.1 Single line diagram
Single line diagrams consist of the most commonly used form of representation of the electrical network. They are widely employed in a large number of studies and analysis functions involving:
- Power systems analysis for ensuring power stability and reliability considering cost effective solutions.
- System fault analysis studies.
- Preparation of metering and relaying schemes.
- Working out load /panel schedules.
Single line diagrams work as key diagrams for the design of an electrical system. Maintaining the latest one-line diagrams and updating them periodically is good engineering practice and helps to ensure the safe, reliable operation of the plant facility.
4.4.2 The 3-line diagram applications
Three-line diagrams are a must for the manufacturing, execution, and maintenance of electrical systems for any plant. They are used for working out:
- Detailed design of power and control circuits for the electrical switchgear assemblies and load control centers.
- Phase sequencing representations
- Displaying differential relay settings
- Displaying potential and current transformer settings
- Maintenance and circuit repair
4.5 Conventions
4.5.1 Single line diagram
General Conventions
Some of the general conventions used while preparing single line diagrams are mentioned as below:
- A one-line diagram is a form of shorthand. For this reason, every line, symbol, figure, and letter has a definite meaning. Therefore, the duplication of names should be carefully avoided.
- As far as practical, indicate approximate relative positions of components in the building or plant. This keeps the drawing intuitive because things are properly located in relation to each other.
- Future plans should be set forth in the diagram, either diagrammatically or by explanatory notes.
- Care should be exercised in the assignment of titles to assure that they identify the installation accurately, without any confusion with any other part of the system.
- No detail within the scope of the diagram should be considered as unimportant, and the rule – when in doubt, show it – should be followed.
Drawing conventions for making a single line diagram
- Preferably A4/A1 size sheet should be used for displaying single line diagrams.
- Use standard symbols for the more common components. Any non-standard symbols to be explained clearly in the legend.
- When drawing/interpreting a single line diagram, you should always start at the top where the highest voltage is and work your way down to the lowest voltage. This helps to keep the voltages and their paths straight.
- Generator should be shown in a circle.
- Use heavy lines to represent buses.
- The thin lines connecting the buses are the power lines. They may represent either transmission or distribution lines
- The arrows represent loads
Common terms associated with single line diagram
Some of the common terms associated with the single line diagram are listed in Table 4.2.
Common terms associated with Single line Diagrams
| Term | Explanation |
| Electrical Bus | The conductor(s), usually made of copper or aluminum, which carries the current and serves as a common connection for two or more circuits. |
| Fault | See “Short Circuit.” |
| Fault Current | The surge of amperage created during an electrical failing. |
| Fixed Low Voltage Circuit Breaker | A circuit breaker rated for less than 1000V and bolted into a fixed position with bus or cable mechanically bolted to breaker terminations. |
| Fully Rated | This is a type of system coordination in which all circuit breakers are rated to operate independently |
| Ground Fault | Current leakage from an ungrounded conductor to the grounding path in an electrical system. |
| Interrupting Rating | The maximum short circuit current that an overcurrent protective device can safely interrupt. |
| Loadcenter | A wall mounted device that delivers electricity from a supply source to loads in light commercial or residential applications. |
| Network Distribution System | Interconnected circuits connect the customer to two or more power sources. Most reliable for continuity of service. |
| Overcurrent | A current higher than the current a conductor or electrical component can safely handle. |
| Overload | A temperature build-up caused by excessive loads on a circuit causing damage to the conductor’s insulation. |
| Panelboard | A wall mounted device that delivers electricity from a supply source to loads in light commercial, commercial and industrial applications. |
| Selectively Coordinated | A type of system coordination in which all circuit breakers are fully rated at the point of application |
| Series Rated | A type of system coordination in which the main upstream circuit protection device must have an interrupting rating equal to or greater than the available fault current of the system. |
| Short Circuit | An electrical fault that is created when two exposed conductors touch or when conductor insulation fails. |
| Single-Phase | A continuous single alternating current cycle. |
| Specification | The detailed descriptions of electrical equipment to be provided for an application. |
| Standards | Guidelines and regulations for the manufacturing of electrical equipment. |
| Step-Down Transformer | Decreases the output voltage that is being supplied. |
| Step-Up Transformer | Increases the output voltage that is being supplied. |
| Three-Phase | A continuous series of three overlapping AC cycles offset by 120 degrees. |
| UL Listed | Listed by Underwriters Laboratory, an independent laboratory that tests equipment to determine whether it meets certain safety standards when properly used. |
Protective relays
Protective relays are commonly used in single line diagrams for denoting protective devices used for generators, motors, transformers etc. Protective relays are denoted through numbers designated by IEEE/ANSI. A device could also be a combination of two relays e.g. 50/51 denotes a combination of instantaneous over current and time over current. Letters can be added to clarify application (87 T for transformer differential, 59G for ground over voltage). The list of relay numbers as per ANSI is provided below:


Abbreviations
Abbreviations are frequently used in single line diagrams. Table 4.3 identifies a few commonly used abbreviations.
Abbreviations used in electrical single line diagrams
| Abbreviation | Definition |
| CT | Current transformer |
| PT | Potential transformer |
| V | Volts |
| kV | Kilo volts |
| W or kW | Power meter |
| kWH | Energy meter |
| A | Ampere meter |
| TP | Three pole |
| FP | Four pole |
| DP | Douple pole |
| VCB | Vacuum circuit breaker |
| ACB | Air circuit breaker |
| OLR | Over load relay |
| OLTC | On load tap changer |
| RTCC | Remote tap changer cubicle |
4.6 Summary
A single line diagram (SLD), also sometimes called the one line diagram, is a drawing that shows by single lines and symbols a simplified layout of a three-phase electrical system. It is a schematic drawing of an electrical power system that uses a concise, standard notation accepted by all power engineers. The single line diagram is the most important drawing that a plant can have for understanding its power system. If properly drawn, it shows a correct power distribution path from incoming power source to each downstream load – including the ratings and sizes of each piece of electrical equipment, their circuit conductors, and their protective devices.
In 3-line diagrams, all three conductors of the three phase system are shown individually. Details of the power and the control circuits are also shown as per actual field connections.
For interpreting and preparing single line diagrams, it is important to be aware of the symbols and conventions used in this field which are described in details in the respective sections of the chapter.
Exercises
1. Please refer to Figure 4.1 and fill in the following details:
Total number of 200 Amp outgoing feeders is: ________________
Rating of the transformer used to step down 13.8 kV to 480 V in kVA: ___________
Current rating of the bus coupler breaker is: ____________
2. Please refer to Figure 4.2 and fill in the following details:
Total number of 4.16 kV circuit breakers shown in the drawing are: ________________
Number of step up transformers shown in the drawing are: ___________
Voltage on the delta side of the step-down transformer is: ____________
3. Please refer to Figure 4.6 shown below and fill up the device names in the blanks. You may refer to Table 4.3 for the same.
4. Draw a preliminary SLD using the information below on the blank template provided in Appendix A.
Incomer:
- CT(with 50/51 n) and PT
- Oil circuit breaker (outdoor) 1000 A , 13.8 kV
- Step down transformer 1250 kVA (delta-wye-earthed)
- CT and PT with Watt hour meter
- Drawout type air ckt. breaker (1600 A )
Outgoings:
- 100 A ACB – 2 nos.
- 200 A ACB – 2 nos.
- 400 A ACB – 2 nos
Single line diagram (Question no. 3)
5
Schematic Diagrams
This chapter explains the purpose and applications of schematic diagrams with the help of practical reading and interpretation exercises for schematic diagrams spread over a number of sheets with explanations for cross-referencing between coils and contacts.
Learning objectives
- To familiarize the readers with the purpose and application of schematic diagrams.
- To familiarize the readers with the techniques for reading and interpretation of practical examples of schematic diagrams spread over a number of sheets with cross-referencing between coils and contacts.
5.1 Purpose
The purpose of electric circuits is to direct and control current flow, at the correct time, to the various components in any system. A broken wire or open switch or wiring error can stop the current from flowing, thereby preventing the system, or part of the system from functioning. A schematic diagram shows an electrical circuit in detail. By clearly depicting individual current paths, it also indicates how the electrical circuit operates. Most schematic diagrams are current flow diagrams. They are arranged from top to bottom, so that we can clearly see how the current flows through the circuit. It shows the different components of the circuit as simplified standard symbols, and the power and control connections between the devices. Unlike the single line or the block diagram, the schematic diagram shows the actual connection details.
5.2 Typical examples
A schematic diagram usually consists of one or more of the following:
- Power circuit diagrams: These provide the details of the power wiring circuits.
- Control circuit diagrams: Control circuits are used to initiate an action for the power circuit to operate. It could consist of devices such as relays, contactors, timers and switches. A motor for example is provided with control for start, stop and protection of the motor. It some cases, motors are also provided with control circuits for reversing, changing speed and sequencing. Control circuits are usually a combination of manual control impulses and magnetic actuators. Manual controls require a person to initiate an action for the circuit to operate which is achieved with the help of push buttons and manual switches. Sometimes automatic actuation can substitute for a manual impulse through magnetic actuators; for example the start and stop of a pump can be done through field mounted level switches. Control circuits also provide details for indication devices.
Please refer to Figures 5.1 and 5.2 for examples of simple schematic diagrams (power and control circuits) for a single motor starter (Star-delta and DOL). Usually power and control circuits are shown on separate sheets in a multi-sheet drawing. You may also want to quickly flick through to Figure 5.9 – the sheets 1 to 3 show the power circuits and the subsequent sheets show the control circuits for the various motors for a press machine control panel.
Note that all schematic diagrams (and most electrical wiring diagrams) are drawn with all supplies disconnected and all switches and circuit breakers open.

Typical schematic for star delta starter
Typical schematic forDOL starter
5.3 Control devices – electromechanical relays and contactors
A relay is a kind of solenoid set up to actuate switch contacts when its coil is energized. Relays are widely used in control circuits. They are used for switching multiple circuits at a time. When a relay is used to switch a large amount of electrical power through its contacts, it is designated by a special name: contactor. A contactor is an electrically controlled switch relay used for switching a power circuit. A contactor is activated by a control input which is a lower voltage /current than that which the contactor is switching.
The operation of the relay and the contactor is almost the same. When power is applied from the control circuit, an electromagnetic coil is energized. The resultant electro-magnetic field pulls the armature and movable contacts toward the electro-magnet closing the contacts. When power is removed, spring tension pushes the armature and movable contacts toward the electro-magnet closing the contacts. The relay has normally open (NO), normally closed (NC) contacts. The poles of a relay describe the number of isolated circuits that can pass through a relay. These circuits are mechanically connected so that they can open or close simultaneously. Contactors and relays come in many forms with varying capacities and features.
The closing of the contacts allows electrical devices to be controlled from remote locations. Contactors are also provided with auxiliary contacts for holding circuits as shown in Figure 5.3.

Auxiliary contact circuits
Some relays are constructed with a kind of ‘shock absorber’ mechanism attached to the armature which prevents immediate, full motion when the coil is energized or de-energized. This addition gives the relay the property of time-delay actuation.
Types of time delay contacts are:
NOTC contact: Shown in Figure 5.4. This is identical to NO contact except that there is a delay in closing action.

NOTC contact
NCTC contact: Shown in Figure 5.5. This is identical to NC contact except that there is a delay in the opening action.
NCTC contact
NOTO contact: Shown in Figure 5.6. This is identical to the NO contact except that on de-energisation it opens after a time lag.

NOTO contact
Protective relays: A special type of relay is one which monitors the current, voltage, frequency, or any other type of electrical power measurement either from a generating source or to a load for the purpose of triggering a circuit breaker to open in the event of an abnormal condition. These relays are referred to in the electrical power industry as protective relays. These relays operate through current transformers (CT) and potential transformers(PT). The circuit breakers which are used for switching of large quantities of power actually electro-mechanical relays with open, close and trip coils. The trip coil is energized and de-energized through one or more protective relays.
Solenoids: Solenoids are mechanisms that convert electrical energy into linear mechanical force.
Pressure/temperature/level switches: These are provided with NO and NC contacts which operate on the set levels.
Permissive and interlock circuits: In control systems several process conditions have to be met before a piece of equipment is allowed to start. A motor or any electrically operated mechanism to be started safely, the control system has to seek permission from a combination of process switches and relay contacts for giving the clearance to the power circuit for switching ‘ON’. This is known as the permissive and interlock circuits (Figure 5.7).

Permissive circuits
5.4 Use of symbols


Symbols in schematic diagrams
5.5 Applications
The schematic diagram is a means of conveying through graphic symbols, the electrical connections and functions of a specific circuit arrangement. The schematic diagram is used to trace the circuit and its functions without regard to the actual physical size, shape, or location of the component devices or parts. The schematic diagram is the most useful of all the diagrams in learning overall system operation.
The schematic drawings find application in representing:
- Power and control circuit diagrams for medium voltage switchboards, HT panels.
- Power and control circuits for motor control centers, lighting and utility control panels, fire alarm control panels, electrical systems for refrigeration, air-conditioning, etc.
- It shows the logic of an electric circuit or system using standard symbols.
- It is used to show the relationship between circuits and their components but not the actual location of the components. Page: 103 Location information is often embedded into a schematic by drawing a box of non-continuous lines with text label indicating the panel/location of a device or devices enclosed within the box.
- They provide a fast, easy understanding of the connections and use of components.
- For trouble-shooting and maintenance of various electrical systems and power/control panels.
5.6 Schematics spread over a number of sheets
Schematic diagrams are usually spread over a number of sheets and the different sheets provide the following details:
- Title sheet
- Three line diagram
- Power distribution circuits
- Control circuits
- Terminal diagrams
An example of schematic diagram for the motor control centre for a press machine is provided in Figure 5.9.
The sheet-wise details are as below:
Sheets 1 and 2: Motor power circuit
Sheet 3: Power circuit diagrams for service plugs and cabinet lamps
Sheet 4: Power circuit for transformer and bridge rectifier for getting 24 V DC from 380 volts AC and
Sheet 5: Alarm circuits for field pressure switches (low and high pressure switch contacts).
Sheet 6: Emergency circuits for press machine stopping
Sheet 7: interlock circuits for emergency stop from external panel, overload relays, tool safety position sensor contacts.
Sheets 8, 9, 10: Fault indication and interlock circuits


Schematic diagram for press machine motor control panel
5.7 Cross referencing between coils and contacts
The schematic diagram usually has a number of sets of contactor coils/relays and each coil may have several NO and NC contacts. Hence a proper reference system for representation of parent coil and child contacts is needed. Electrical drawings use reference-only representation of each child contact on the parent symbol and position its single piece of cross-reference annotation under it or near it. The designer keeps each one of these discrete cross-references up-to-date. In the parent relay symbol shown in a schematic drawing, the vertically oriented text right below each reference-only contact representation points at the sheet and line reference location of where that child contact is actually found. In addition, the contact automatically references the location of the coil.
Example of cross-referencing:
Please refer to the sheet number 5 of Figure 5.9. The diagram shows three coils with reference numbers K55, K59 and K57. Please refer to the list provided below each coil for the reference of the contacts. For K55 coil, 2 nos of NO contacts are provided- one on 8.0/B (page no. 8, column ‘0’ and row B) and another on 8.3/C. one NC contact has been provided on 9.6/C. Also if you go to sheet no. 8 , column number ‘0’ and row no. B, you can find the reference of the coil mentioned beside the contact K55/5.4E i.e. the contact is for the coil no. K55 mentioned on page 5, column ‘4’ and row ‘E’.
5.8 Summary
The schematic diagram shows an electrical circuit in detail. By clearly depicting individual current paths, it also indicates how the electrical circuit operates. Most schematic diagrams are current flow diagrams. They are arranged from top to bottom, so that we can clearly see how the current flows through the circuit. It shows the different components of the circuit as simplified standard symbols, and the power and control connections between the devices.
A relay is a kind of solenoid set up to actuate switch contacts when its coil is energized. Relays are widely used in control circuits. They are used for switching multiple circuits at a time. When a relay is used to switch a large amount of electrical power through its contacts, it is designated by a special name: contactor. A contactor is an electrically controlled switch relay used for switching a power circuit. A contactor is activated by a control input which is a lower voltage /current than that which the contactor is switching.
The operation of the relay and the contactor is almost the same.
The schematic diagram usually has a number of sets of contactor coils/relays and each coil may have several NO and NC contacts. Hence a proper reference system for representation of parent coil and child contacts is needed. Electrical drawings use reference-only representation of each child contact on the parent symbol and position its single piece of cross-reference annotation under it or near it. The designer keeps each one of these discrete cross-references up-to-date. In the parent relay symbol shown in a schematic drawing, the vertically oriented text right below each reference-only contact representation points at the sheet and line reference location of where that child contact is actually found. In addition, the contact automatically references the location of the coil.
Exercises
1. Please refer to sheet no.1 of Figure 5.9. The power circuit for 3-phase motor M1 uses a star-delta starter through contactors K99 and K97. Which is the reference no. of the coil with timer for the star-delta change-over? Which is the reference number of the indication lamp for ‘MAIN MOTOR ON’? How many NO and NC contacts been utilized for K99?
2. Please refer to sheet no.5 of Figure 5.9. Coil nos K55, K57 and K59 have interlocks with which pressure switches and which sheet gives the interlock details of NC contacts of these coils?
3. Please refer to sheet no. 10 of Figure 5.5. Contact of which coil is provided for in the indication lamp circuit for ‘FAULT IN LUB’? What is the type of contact – NO or NC utilized for this indication circuit?
4. Please refer to sheet no. 7 of Figure 5.9. Which are the overload relay contacts associated with the operation of the coil K81 for operation of ‘EMERGENCY STOP’ for the machine?
6
Logic Diagrams
This chapter explains the purpose and applications of logic diagram. It explains the elements of logic diagrams, the symbols used in logic diagram and provides examples and exercises for their understanding and interpretation based on process interlock requirements.
Learning objectives
- To familiarize the readers with the basics of logic diagrams with their purpose and application.
- To familiarize the readers with the techniques for understanding and interpreting logic diagrams.
6.1 Purpose
6.1.1 What are logic diagrams?
Logic diagrams are easy to read graphic representations of the operation of system equipment controls using basic digital logic symbols. These symbols functionally relate manual and process input actions to the process control and operator display output actions. The logic diagram in itself does not provide the details of the hardware to be used or the details of the control signal levels but it works as a basis for other drawings such as electrical schematics or solid-state logic systems.
Before the advent of solid-state logic circuits, logical control systems were designed and built exclusively around electromechanical relays. Relays are far from obsolete in modern design, but have been replaced in many of their former roles as logic-level control devices, relegated most often to those applications demanding high current and/or high voltage switching. Solid state logic circuits are in common use now and these are based on voltage levels. These are designed to input and output only two types of signals: ‘high’ (1) and ‘low’ (0), as represented by a variable voltage: full power supply voltage for a ‘high’ state and zero voltage for a ‘low’ state.
6.1.2 The three basic sections of the control logic circuit for any process are:
- Signal sectionThe signal section receives the signal or input from the field through a switch e.g. pressure switch/temperature switch/limit switch/push buttons/flow switch, etc.
- Decision/interlock sectionIt deciphers the signals, performs the logic operations and gives command to the action section of the circuit through the control devices. The way the control devices are connected in the control circuit gives the control logic. The control logic is performed through a combination of logic functions. The various logic functions are AND, OR, NOT, NAND and the XOR and XNOR logic.
- Action sectionAfter the logic decision is performed in the decision section the command is given to the action section. The command is given indirectly to the load such as the motor or through an intermediate element such as a relay energizing coil.
6.1.3 Thus the logic diagrams have two main purposes
- To explain the functionalities of the control system.
- To help the designer create the logic for the system.
6.2 Logic gates
Logic diagrams are based upon the logic elements called gates. A logic gate performs a logical operation on one or more logic inputs and produces a single logic output. The logic normally performed is Boolean logic and is used to generate outputs in the decision section of the control circuits. The output of these gates are ‘0’ (low) or ‘1’ (high).The simplification of logic diagrams can be done with the help of Boolean Algebra. The basic logic gates are the AND, OR and NOT gates. Truth table for the various logic gates with analogies of electrical circuits for some of the gates is provided below each example.
6.2.1 AND gate
The AND gate is used in a circuit when two or more signals are used in the series.

Figure 6.1 consists of two manual signals (push buttons) wired in series for energizing a solenoid as an example of two input AND gate. The solenoid is energized only when both pushbuttons are pressed.
AND gate
6.2.2 OR gate
The OR gate is used in a circuit when two or more signals are used in the parallel.

Figure 6.2 consists of two signals ( a push button and a temperature switch) wired in series for activating a heating element as an example of two input OR gate. The heating element gets activated when either the push button or the temperature switch is closed.
OR gate
6.2.3 AND/OR combination gates
When a combination of switches in parallel and series is utilized, it forms a combination of AND/OR gates. Please refer to Figure 6.3 for circuit based on combination of AND and OR gates.
Combination of AND/OR gates
6.2.4 NOT gate
This generates an output only when there is no control supply (please refer to Figure 6.4).
NOT gate
6.2.5 NOR gate
This generates an output only when there is no control supply in both the inputs (please refer to Figure 6.5).

NOR gate
6.2.6 NAND gate
This generates output except when both the inputs are high.

6.2.7 Exclusive OR gate
This generates output except whenever exactly one of the inputs is high.


6.2.8 Exclusive NOR gate
This generates an output whenever both the inputs are either high or low.

6.3 Typical examples
Figure 6.6 shows the control logic for a solenoid valve which can be operated automatically in ‘Auto’ mode or manually through a hand switch with ‘OPEN’, ‘CLOSE’ and ‘AUTO’ positions. A limit switch in the field sends a signal that the valve is fully open. Only when this signal is activated, the valve remains open in the ‘AUTO’ mode. Otherwise it remains open as long as the hand switch is manually kept at the “OPEN’ position.
Logic diagram for solenoid valve circuit
Figure 6.7 shows the control logic for a fuel oil pump circuit. The ‘Pump Running’ signal is received from the field. The pump can be started through auto start or through the start push button subject to start permissive signal from the interlock circuit. The pump can be stopped through the automatic stop or through the stop push button. If the pump fails to start in spite of start signal, an alarm indication is provided and also the pump start signal and auto select signal is reset. The indication for ready shows that permissive have been met and that the pump can be started by the operator. The process trip signal send alarm indication and also resets the auto start mode.
Logic diagram for pump start/stop and indication circuit
6.4 Symbols
A list of symbols most commonly used in logic diagrams is provided in Figure 6.8.

Symbols for logic gates
6.5 Applications
Logic diagram has a primary purpose to work out in enough detail what the control system is supposed to accomplish, in what sequence and under what conditions. It establishes an interface between the equipment or process and the designer. It is a design and construction document based on which detailed schematics and wiring diagrams are made.
Logic diagrams are used for the preparation of basic electrical control and interlock schemes for the following:
- Motor operated valves
- Solenoid valves
- Equipments with complex controls such as boilers, furnaces, pumps, compressors, filters etc.
- Machines for manufacturing operations such as lathe/turning machines
- Filling stations
- Motors control centers
- Process trip and interlock circuits.
- Emergency shut down systems
6.6 Logic diagrams spread over a number of sheets
Figure 6.9 below shows the logic command for a lathe machine operated through a star-delta motor and explained in Section 6.7.


Logic diagram for lathe machine operation
6.7 Cross referencing
The logic diagrams can run into several sheets creating the necessity for cross-referencing between the various gates and contacts. In such cases the diagram is usually divided into segments and the cross-reference list is provided at the bottom of the sheet.
Please refer to the multi-segment logic diagram shown in Section 6.6. The diagram provides the logic details for a lathe machine. The Segment 2 of the diagram provides details of the conditions under which the ‘SPINDLE ON FORWARD CONTACTOR’ will get energized. The diagram uses the IEC symbols. The OR gate is energized through either the ‘SPINDLE FORWARD PUSHBUTTON’ or the ‘SPINDLE FORWARD’ command from the automatic permissive circuit. The AND gate is energized only when there is signal from the previous OR gate and it also checks the signals from the SPINDLE OVERLOAD RELAY and SPINDLE OFF PUSHBUTTON. The contactor for SPINDLEFORWARD gets energize by the signal from this AND gate. The cross reference list provided at the bottom of the diagram ‘X reference list outputs’ mentions SPDLFWD with a ‘*’ indicating that this segment provides details for the energisation of the contactor and the other segments mentioned without the ‘*’ utilize only the NO/NC contacts of the contactor.
6.8 Summary
Logic diagrams are easy to read graphic representation of the operation of system equipment controls using basic digital logic symbols. These symbols functionally relate manual and process input actions to the reprocess control and operator display output actions. The diagram in itself does not provide the details of the hardware to be used or the details of the control signal levels but it works as a basis for other drawings such as electrical schematics or solid-state logic systems. The basic purpose of the logic diagrams is to explain the functionalities of the control system and to help the designer create the logic for the system.
Logic diagrams are based upon the logic elements called gates. A logic gate performs a logical operation on one or more logic inputs and produces a single logic output. The logic normally performed is Boolean logic and is used to generate outputs in the decision section of the control circuits. The output of these gates are ‘0’ (low) or ‘1’(high).The simplification of logic diagrams can be done with the help of Boolean Algebra. The basic logic gates are the AND, OR and NOT gates.
Exercises
1. Refer to Figure 6.6 to answer the following questions.
The number of ‘OR’ gates used is: ________
The number of ‘AND’ gates used is: ________
The number of ‘NOT” gates used is: ________
Under what conditions does logic gate ‘1’ get energized?
If the input signal from safety interlock circuit is high, will the output be sent by gate ‘2’ for valve opening?
Under how many conditions does the valve get energized and which are those conditions?
2. Please refer to Figure 6.7 to answer the following questions:
The number of ‘OR’ gates used is: ________
The number of ‘AND’ gates used is: ________
The number of ‘NOT” gates used is: ________
Under what conditions is the ‘Start’ signal sent to the field?
The ‘Pump fail’ signal is utilized for resetting which signals and why?
Under what conditions is the ‘Pump Ready’ signal displayed?
7
Cabling and Wiring Drawings
This chapter explains the purpose and applications of cabling and wiring diagrams. It explains the various types of cabling diagrams used in the industries, and provides examples and exercises for their understanding and interpretation.
Learning objectives
- To familiarize the readers with the purpose and application of different types of cabling and wiring diagrams.
- To familiarize the readers with examples of various types of cabling diagrams.
7.1 Purpose
7.1.1 Plant cabling system drawings
The sole function of an electric cabling system is the transfer of electric power. The load to be supplied can vary from a small indicating lamp to a large generator transformer. Cables refer to insulated, sheathed (and sometimes armored/screened) conductors which are usually run on structures, sometimes buried directly in ground and less often within metallic conduits. When entering a building or a facility, the entry is effected through conduits (with each conduit having one or more cables passing through).Cabling drawings are a part of the detailed design and engineering activity of a project. These drawings are usually prepared on the basis of the single line diagram, the load schedule, equipment schedule and piping/plant layout drawings.
Wire and cable systems are designed for long life with a minimum of service interruptions. IEEE, NEC and NEMA provide overall guidance in planning, designing and installing wire and cable systems in a plant.
7.1.2 Cable system classification
- Power and lighting conductors include circuits from the station service switchgear to distribution centers or to station auxiliary equipment; branch circuits and control circuits from distribution centers to auxiliary equipment; feeders to lighting panels; and lighting branch circuits.
- Control cables include station control and annunciator circuits from the control room switchboards, unit instrument boards, exciter cubicles, and secondary control centers.
- Analog and digital signal cables for instrument signals.
7.1.3 Purpose served by different types of cabling drawings
- To show the power connections between various electrical devices (cables for power distribution systems).
- To show the route for the conductors and their mechanical support systems such as trays, conduits etc. (cable layout/route drawings and tray layouts/conduit layouts etc).
- To show the electrical interconnections between different systems and subsystems (control interconnection diagrams).
- To help the designers work out the optimum conductor sizes with the respect to the connected load (cable schedule and cable block diagram).
- Works as a basis for development of civil/structural drawings i.e. for working out designs for cable trenches, underground pathways, overhead raceways along with support systems, etc.
- Works as a basis for spacing management for cable pathways and spacing management.
- Cabling documents such as the cable schedule, conduit/tray schedules form a very important and mandatory part of the Bill of material and price schedule calculations during the tendering stage of any project involving electricals.
7.1.4 Wiring diagrams
Wiring relates to connections for utility equipment such as lights, fans, socket points etc. using unsheathed insulated wires (usually single conductors run within conduits). In another plane, internal connections within control panels, motor control centers, etc. are also based on wiring diagrams.
7.1.5 Purpose served by different types of wiring drawings
- To show the power connections for utilities, lighting systems, etc.
- To show the internal schematic connections within a control panel, MCC, switchboard etc.
- To show the control connections between various control components (control systems drawings).
7.1.6 Differences between cabling and wiring drawings
- Wiring diagrams when referred to utility power connections, are often schematic in nature and carry less detail about locations/routing (for example please refer to Figure 7.5) and details are expected to be decided during construction.
- Cabling drawings are usually more detailed and have to be exactly followed by construction crew and therefore have to be complete and self-contained in all respects.
- Wiring diagrams when referred to internal wiring diagrams of a panel are comprehensive diagrams providing detail of each electrical circuit system showing all the connectors, wiring, terminal boards, signal connections (buses) between the devices and electrical or electronic components of the circuit. They also identify the wires by wire numbers or color coding. Wiring diagrams are necessary to troubleshoot and fix electrical or electronic circuits. Please refer to Figure 7.15 for an example of a panel wiring diagram.
7.2 Sub types of cabling and wiring drawings
7.2.1 Cable and conduit numbering procedures
The cable and conduit numbering procedure for any project usually depends on the particular company standards or as per the client’s requirements for a specific project. However, generally the identification or tag numbers assigned should give information about the service rendered by the cable, the termination points of the cable, and the approximate voltage or power classification.
A typical cable numbering procedure followed in a plant is mentioned below as an example:
Each cable between major units of equipment or from switchgear assemblies in the electrical room to structures external to the electrical room is assigned a number made up of three parts, as follows:
- The first part of the cable number shows the beginning of each cable run and is composed of uppercase letters and numerals assembled into a code to represent the various major units of equipment, switchgear, switchboards, cabinets, etc., located throughout the electrical room.
- The second part of the cable number is composed of a single lower-case letter and number. The letter indicates the type of service rendered by the cable, i.e., power, alarm, etc., while the number serves to differentiate between cables of a particular type running between two points.
- The third part of the cable number shows the termination of each cable run and is composed in the same manner as the first part of the cable number.
Figure 7.1 shows the abbreviations used in the examples for cable numbering mentioned below:
Example:
Cable ID: SC-u3-G1
Breakdown: SC = Start of cable run (Main control switchboard)
u = Type of service (Annunciator lead)
3 = Number of such cable (3rd annunciator lead cable to Generator No. 1; there might be 6 or 9 cables, for example, each with its own number)
G1 = Termination of cable (Generator No. 1).
Cables between low-voltage equipment (such as motor control centers) and minor units of equipment (such as station auxiliaries) have no code letter and numeral to show the termination of the cable run. The cable numbers in these cases are made of only two parts. The first part indicates the start of the cable run, while the second part indicates the type of service rendered by the cable.
Example:
Cable ID: CQ5-c12
Breakdown: CQ5 = Start of cable run (480-V load center No. 5)
c = Type of service (Control circuit)
12 = Circuit number
Numbers are assigned to the power and control cables so the power circuit of a given number is controlled by a control circuit having the same number, the differentiation being only in the code letter designation of the circuit duty. As an example, cable “CQ5-c12” would be the control for power circuit “CQ5-q12.” There are cases where a circuit terminates at several duplicate devices. For instance, an annunciator circuit runs to a junction box and is spliced at this point with branches running to a thermostat in each tank of a transformer bank. In such a case, the cable from the switchboard may have a designation such as S1-u2-T1 and the branch designations are S1-u2.1-T1, S1-u2.2-T1, and S1-u2.3-T1.
Conduit and cable are usually given the same designation if possible. Spare conduits are numbered by using a three-part number where possible. In cases where the spare conduits leave a certain switchboard or distribution center and are stubbed at the end of the building, only a two-part number can be used, e.g. CQ01-s1 is a spare conduit leaving motor control center CQ01.


Abbreviations used for cable numbering procedure
7.2.2 Cable/conduit/tray schedules
The intent of the conduit, cable and tray schedule is to provide all pertinent information to assist in installing, connecting, identifying, and maintaining control and power cables. Each cable and conduit should be identified with an individual designation. The cable and conduit are tagged with a designation at each end and at intermediate points as necessary to facilitate identification. The designation is also shown on equipment wiring diagrams, tray loading diagrams, on conduit plans and details, on cabinet layouts, and on junction and pull box layouts.
The scheduling of cables should always include (opposite the cable designation) the following information:
- Number and size of conductor.
- Function or equipment served.
- Origin and destination.
- Routing via conduits and trays.
- Special conditions.
- Estimated length.
Please refer to Figure 7.2 for an example of a cable schedule.
The scheduling of conduit should include (opposite the conduit designation) the following:
- Size and type of conduit.
- Function or equipment serviced.
- Origin and destination.
- Special conditions.
- Length.
Cable tray/conduit management is a part of the cable management system which comprises of the various categories of high voltage and low voltage cables, power cables (load carrying cables), control cables (non-current carrying cables), instrument and data cables. While designing cable racking systems, coordination with other systems such as mechanical systems, plumbing systems, fire-sprinkler systems, and building structure has to be done. Generally, cable management is one of the last considerations in the design and construction phases of a project. Therefore, a solution is required that will allow planning around these systems, despite not knowing their final destinations and elevations. Once the cable volumes passing over each rack are known, the amount of trough space required at each rack can be determined. To prevent the risk of noise within instrument cables, power and control cables should be separated. Therefore, cable volume (or cable fill area) required for power/control and instrument cable are considered separately although power and control cable can be located on the same tray. High voltage cables are usually laid on a separate tray to prevent interference. Calculations are made based on the National Electric Code which has a section which governs cable trays.
A cable tray schedule provides the following information:
- Raceway/rack/tray no.
- Dimensional detail
- Source (From)
- Destination (To)
- Function (Power, control, analog, digital, etc.)
- Number of cables and sizes
- Number of tees, bends, crossovers, etc.
- Fill area

Example of a cable schedule
Example of a cable tray schedule
7.2.3 Cable layouts
Cable layouts are prepared on the basis of the plant layout, electrical layout/ equipment layout, power distribution system layout and the load schedule. This is a diagram which shows the layout of the plant cabling system.
Cable layouts comprise of the following:
- Cable tray layouts: These provide details of the cable tray routing, support systems, cross sectional details etc.
- Conduit and wiring layouts: These are provided mostly for lighting and utility circuits.
- Cable layout for underground cables: These provide details of duct banks, cable trenches, concrete troughs, etc.
- Pull box/junction box layout. (Pull box is an enclosure for joining conductors which also provides by its size, arrangement, and location the necessary facilities for pulling the conductors into place. This term as used here includes structures also known as ‘manhole’, ‘hand hold’, and ‘switch board pull section’.) For example please refer to Figure 7.9 – pull box layout for outdoor illumination and other electrical services.
- Details for duct banks (A duct bank protects electrical lines that are beneath the ground from accidental breakage. They consist of electrical cables within round ducts encased in reinforced concrete in paved/unpaved areas, crossings). Please refer to Figure 7.10 for example of a duct bank detail drawing.
- Pull box/junction box wiring and cross-section details
- Details of cable trenches (Please refer to Figure 7.11 for sectional detail of a cable trench).
- Cable identifications and markings.
- Details of cable mounting on rack, cable fastening systems, conduit support systems.
- Details of cable termination and mounting diagrams (if required or can be provided separately).
Figure 7.3 is an example of a plan drawing showing layout of cable from the Motor Control Centre to the Pump Area. The tag numbers of the cables both power and control which are passing through the cable trench are mentioned in the drawing. For example P001 is the power cable and C 001 is the control cable connected to the motor 3580-NPP-001/M1 and so on.
Figure 7.4 is an example of Wiring Diagram for conduits (indoor illumination and utility power supply). The drawing provides the details of the circuit number for the conduits and their connection scheme with the lighting fixtures, power sockets etc. The legend in the drawing shows details for the fixtures and utilities. Figure 7.5 provides details for wiring and looping in pull boxes (concealed junction boxes).
Figure 7.6 is an example of the site plan of a plant which shows the layout for new cable tray installation routes and dismantling of old cable trays. The legend provided in the drawing provides details of the sizes of cable trays and accessories to be installed.
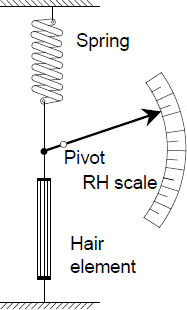
Example of a cable layout

Wiring layout

Wiring layout
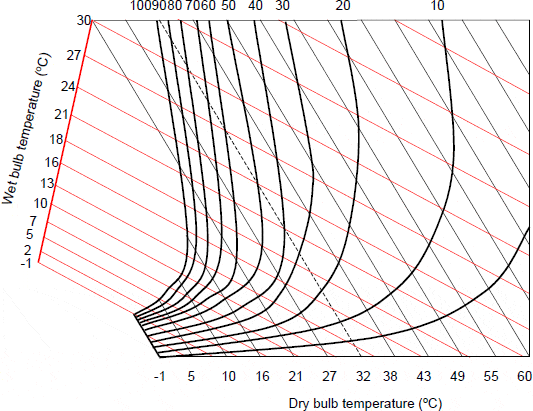
Pull box wiring and loop details
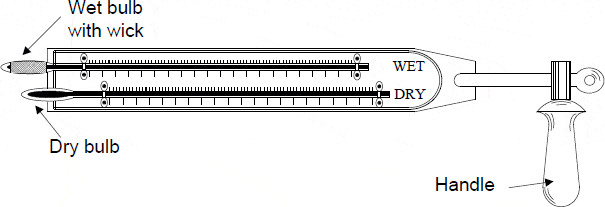

Site plan for cable tray installation
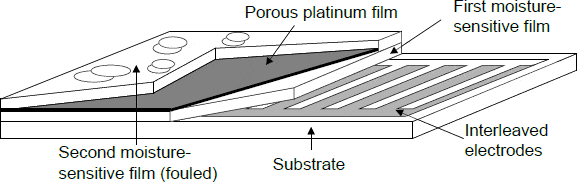
Cable tray support assembly
Pull box layout and cross sectional detail for outdoor illumination and other electrical services

Duct bank detail

Examples of cable trench detail
7.2.4 Applications of cable/conduit/tray schedules
- Laying and execution of plant cabling systems.
- Guiding drawing for plant maintenance personnel for troubleshooting and maintenance of cabling systems.
- For working out estimates of cable/conduit/tray lengths and bill of materials/costing sheets for accessories.
- Working out voltage drop calculations
7.2.5 Control cable interconnection diagrams
Electrical equipment may require controls from various sources and systems. In such cases control wiring for the equipment requires interconnections between the different systems which may have varied locations. These interconnections could be made through a panel or a junction box. Interconnection diagrams and listings show details of all control interconnections in the plant including TJBs (terminal junction boxes), MCCs and Control Panels. These diagrams differ from wiring diagrams in the way the information is organized (according to multi-conductor cables or TJBs and terminal strips). For example, in an interconnection diagram, all connections on the either side of a multi-conductor cable are shown together or alternatively all connections to terminal strips in a TJB are shown together.
Interconnection diagrams are usually represented in the form of a listing (please refer to Figure 7.12 interconnection diagram for motorized valve control cable). However they may also be represented in the form of diagrams as shown in Figure 7.13 (control cables interconnections between Control Panel and Terminal box) and Figure 7.14 (control cable interconnections between field mounted solenoid valves, motors and flow/pressure/limit switches).
Example of interconnection diagram (1)

Example of interconnection diagram (2)
Example of interconnection diagram (3)
Applications of control cable interconnection diagrams are:
- Wiring and commissioning of equipment.
- Plant maintenance and troubleshooting.
7.2.6 Panel internal wiring
Panel internal wiring diagrams are prepared once the single line diagram, the logic diagram and the control schematic have been finalized. Panel internal wiring diagrams provide the following details:
- Wiring details for the power circuits
- Wiring details for the control circuits
- Coil and contacts cross-referencing details
- Terminal block details
An example for panel internal wiring diagram for the control panel of a rotating equipment testing equipment is shown in Figure 7.15.
Applications of panel wiring diagrams:
- For panel manufacturing
- Trouble shooting and maintenance
- Inter-connections between equipment and commissioning of systems
Example of wiring diagram for the control panel of a rotary equipment testing machine
7.2.7 Terminal diagrams
These are used for providing details of terminal strips for junction boxes, control panels, etc. Terminal diagrams provide details of the terminal number and the corresponding ferrule number of the outgoing cable to be terminated at the particular terminal. An example for the terminal diagram for the control panel of a rotating equipment testing equipment is shown in Figure 7.16.

Example of a terminal diagram
7.3 Conventions used
Some of the common conventions used in the cabling and wiring diagrams are:
- Cable layout drawings should be scale drawings and the scale should be clearly mentioned.
- Cable layout drawings are usually superimposed on the plot plan/pipe rack layouts.
- Cable layouts are usually made on A1 size sheets.
- Cable layouts should provide the north symbol and the key plan.
- The spot location of electrical equipment and their identification numbers to be provided.
- Elevation details of cable racks should be provided to prevent obstruction with other items of tray work/ladder routing and with other services e.g. pipe work etc.
- Cross-sectional details showing mounting arrangement of racks should be provided.
- Cable layouts should provide cross sectional details showing the arrangement and spacing of conductors.
- Size and specification of cable trays and their heights above finished levels should be provided.
- Panel wiring diagrams should have cross-referencing details for coils and contacts.
7.4 Summary
Cabling and wiring drawings are a part of the detailed design and engineering activity of a project. These drawings are usually prepared on the basis of the single line diagram, the load schedule and equipment schedule. The different types of cabling drawings are the cable schedule/layout, conduit/tray schedule/layout, control cable interconnection diagram and the panel internal wiring diagrams. The cabling drawings are important at all stages of project execution right from the tendering stage to the plant operation and maintenance stage.
Exercises
1. Refer to Figure 7.1. What do the following Cable Tag nos represent?
i) LT – r1
ii) SQ1 – q3 – QPL
2. Refer to Figure 7.7. What are the approximate sizes and lengths of the new cable trays to be installed as per the site plan shown?
3. Refer to Figure 7.9. What is the number of the proposed pull boxes and existing pull boxes shown in the drawing?
4. Refer to Figure 7.12. What is the cable name and the function texts for the different cores of the cable shown in the diagram?
5. Refer to Figure 7.16. What is the terminal strip no. and the terminal numbers connecting the cable from Tachometer to the Generator G1?
8
Layout Drawings
This chapter explains the purpose and applications of electrical layout drawings. It explains the various types of layout drawings used in the industry, and provides examples and exercises for their understanding and interpretation.
Learning objectives
- To familiarize the readers with the purpose and application of different types of electrical layouts such as electrical floor plans, lighting layouts, earthing layouts
- To familiarize the readers with examples of various types of electrical layout plans, drawings and schedules.
8.1 Purpose
On any given construction project, multiple parties work together toward common goals: to complete the job on time, on budget, and without any accidents or injuries. From the engineer to the general contractor to numerous subcontractors, individual participants in the overall project must have a detailed road map before embarking on their journeys. Serving a number of different purposes, the various types of layout plans and schedules prepared by engineering firms and distributed to key players provide a means for effective project navigation. Project execution requires inter-disciplinary co-ordination e.g. layout drawing for the electrical equipment would be referred by the various departments apart from the electrical such as the civil and the mechanical. Also the installations need to be carried out inline with the safety recommendations of the statutory bodies such as the NFPA/NEC and the local governing agencies which give permissions for these installations based on the electrical schedules and the layout drawings.
Schedules are a systematic way of presenting list of equipment, fixtures or devices in a tabular form in a proper organized manner. Representing data in a tabular form not only makes easy to comprehend but also makes it easier to monitor and maintain. Tabular data or schedules enable a lot of time saving for the project execution, monitoring and the maintenance team.
The layout drawing is an accurate development of the conception of the design, or the placement of units. Essential elements are developed, and the geometry of the equipment is dimensionally defined taking into consideration its function, manufacture and other requirements. Several layouts may be required for one plant. In making the layout, the basic reference lines and center lines are located. Adjacent or existing parts are drawn in phantom lines. This conveniently defines the space available to work. The general shape of each equipment member is approximated and calculations are carried out simultaneously which finally determines the actual sizes. Sometimes the layout, the design sketches and calculations are made simultaneously because each provides information that is needed for the other. Layout drawings are always drawn to scale, full scale if possible. Layout drawing can also be done rapidly on squared paper to give the scale. The prime consideration is accuracy – only a minimum of necessary essential graphical information is presented.
8.2 Conventions used for layout drawings
General conventions used for the layout drawings are:
- Layout drawings should be scale drawings and the scale should be clearly mentioned.
- To be clear to the installer the scale of the drawing should be chosen to at least 1:100. Typical details may be to a different scale such as 1:50 or 1:25.Layout drawings are generally prepared on A1 size sheets. Outdoor areas with sparse details can be drawn to scales of 1:200 and key layouts even at 1:500.
- Key plan if required should be provided.
- North symbol should be provided.
- Sectional details, notes and bill of materials to be provided.
- Mounting and structural details should be provided.
- General notes mentioning reference schedules should be mentioned.
- Legend and bill of material should be provided.
- Match lines and battery limits should be provided.
8.2.1 Components of layout drawings
A drawing set includes general drawings, such as plot plans, floor plans, elevations, and isometric views. Also included are detailed drawings, such as sectional views and construction details.
Plant layout drawing and the plot plan
Plant layout refers to the arrangement of physical facilities such as machinery, equipment, furniture etc. within the factory building in such a manner so as to have quickest flow of material at the lowest cost and with the least amount of handling in processing the product from the receipt of material to the shipment of the finished product.
Plant layout drawings or plot plans are considered key documents to projects and are normally initiated in the pre-contract, conceptual and development stages of a proposal. Located within the boundaries of the available property, rough equipment sizes and shapes are pictorially positioned. Along with anticipated pipe rack configurations, structure shape and rough sizes. The plot plan at this level of detail is then used for constructability evaluation and is normally submitted to the client for approval. Once approved by the client, almost every group including Engineering, Scheduling, Construction, Operations, Cost Control, Estimating and Material Control use the plot plan as a pictorial reference for their work. At this point, the plot plan becomes a universal document used by all groups to interface with one another and the client.
An example of a typical plant layout is shown in Figure 8.1.
Figure 8.2 shows the partial layout of a power plant with the location of the major equipment: transformer, generator circuit breaker, turbine, waste water treatment plant (WWTP), pipe rack, control room, workshop, office building, etc.

Typical plant layout diagram

Partial layout of a power plant
Elevation views
These are drawings that show the front, rear, or side views of a building or a structure. Constructional details are usually noted on the drawings and prominent features are also provided. It primarily describes the vertical relationship between the components. Figure 8.3 shows the elevation diagram of cable tray system.

Elevation drawing of cable tray system
Sectional views
Sectional views are used to show how a structure looks when it is cut by an imaginary vertical plane. The structure is usually drawn to large scale and shows details of a particular construction feature that cannot be explained by plans and elevations alone. The sectional drawing provides information about dimensions, materials, fastening and support systems, and concealed features.
Figure 8.5 shows an example of sectional drawing showing foundation details of a pad mounted transformer. The sectional details at ‘AA’ are shown separately.
Sectional details for the foundation of a pad mounted transformer
Detail views
Detail views are provided on the drawings where the plan and the elevation do not clarify the construction of a particular detail sufficiently and the same need to be shown at a different scale. Large scale drawings of features that either do not appear or are too small on plans, elevations, and sections are shown in details. Details are usually keyed by a coding system to the drawing from which they were taken. Figure 8.5 shows the partial view of a plot plan where detail A is provided to show the details of manhole MH22 which joins the underground cable and the overhead cable.

Example of detail in a layout drawing
8.3 Sub types of layout drawings
8.3.1 Electrical equipment layout
The design of the electrical equipment is prepared once the single line diagram and the equipment and load schedules have been finalized. The General Arrangement and the foundation details form a basis for the finalization of the electrical equipment layout.
The design considerations for the equipment layout are the following:
- Guidelines of the NEC.
- Cooling and humidity requirements of the equipment.
- Ventilation requirements.
- Minimal space requirements between the electrical equipment and physical/civil structure (such as wall) or between electrical equipment.
- Accessibility of equipment for repair and servicing.
- Emergency accessibility requirement.
- Structural and seismic requirements.
- Earthing requirement.
Please refer to Figure 8.6 which shows equipment layout (HT switchgear, transformers, etc.) in a plant.

Equipment layout
8.3.2 Earthing system layout drawings and diagrams
The earthing system drawings and layout diagrams are used to illustrate the following:
- Details of the earthing network which is installed throughout the plant(s) to provide for: safety earthing, protection against lightning and static charges. The earthing network details should indicate the details of the ring conductor system or systems with earthing points, dividing points, equipment earthing conductors and the requirements for safety earthing. When required by the area the earthing network details can be divided into a plant earthing grid system and several ring conductor systems which are electrically interconnected.
- Plant earthing grid: Consists of evenly spaced earth electrodes and conductors in the form of a mesh. Please refer to Figure 8.7 which shows the earthing system layout in a power plant. Note that the substation earthing ring and plant earthing ring have been joined as a standard procedure. Figure 8.8 shows another example of a plant earthing grid.
- Substation earthing: Consists of evenly spaced earth electrodes and conductors in the form of a mesh. Please refer to Figure 8.9 for example of a substation earthing layout. Details of earthing points consisting of earth electrodes and earthing pits. Please refer to Figure 8.10 which shows the details of earth electrode and earthing point.
- Details of dividing points: Dividing points are provided in the earthing system of copper/GI bar of required size and made suitable to receive the connections: from the earthing point, the main loop and the possible earthing conductors to equipment (please refer to Figure 8.12).
- Inspection pit for earth electrode: Please refer to Figure 8.11 for an example of an inspection pit. Instrument earthing system: An earthing network for the instrumentation system of the plant is provided which is again connected to the main electrical earthing grid. Please refer to Figure 8.13 for an example of earthing scheme for instrumentation.
- Equipment earthing system: Consists of connection of major plant equipment such as tanks, pumps, switchgear at multiple points to the earthing grid through earthing conductors. Please refer to Figure 8.14 for examples of equipment earthing drawings.
- Schematic showing neutral earthing of generators, transformers, switchgears, etc.

Earthing layout in a power plant

Earthing grid example

Substation earthing layout

Details of earth electrode and earthing point

Inspection pit of an earthing point

Dividing point for earthing

Plant instrumentation earthing

Example of equipment earthing drawing

Neutral earthing schematic
8.3.3 Lightning protection system layout drawing:
- A Lighting protection system (LPS) layout drawing should provide details for the following:
- Air terminal (rods) (is part of the LPS that is intended to intercept the lightning flashes).
- Down Conductor (cable) (is part of the LPS that is intended to conduct the lightning current from the air terminals to the ground terminations).See Figure 8.16.
- Bonds to metallic bodies: The lightning protection system mesh is connected to all major metallic bodies.
- Ground terminations (is the part of the LPS which is intended for dispersing the lightning current to the ground). Please refer to Figure 8.19.
- Surge arresters (these are provided for providing extra protection for places where the probability of lightning strike is higher).
Please refer to Figure 8.17 which shows an isometric view of the Lightning Protection System for a building. Figure 8.18 shows an example of the Lightning Protection System grid.

Down conductor

Isometric view of the lightning protection system

Lightning protection system grid

Ground termination
8.3.4 Lighting system drawings
Lighting drawings mostly comprise of the following:
Lighting layouts: These should be clear, unambiguous illustration of luminaries placement and application intent. The layouts with circuiting, panel board assignments and control methodologies should appear on the drawings. Exact lighting fixture positions should be included on architectural-reflected ceiling plans, site plans, or elevations to assist in interdisciplinary coordination. They should indicate key dimensions and mounting information, related to structural reference points, to inform the specifics of location.
The lighting layout should have the following sections:
- Notes section providing guidelines for installation and mounting. An example for the typical notes section provided on a lighting layout is shown in the Figure 8.20.
- Legend section providing details of symbols used for the various fixtures, receptacles, sockets, appliances etc. A typical example is shown in Figure 8.21.
- Lighting fixture schedule which should provide details of the luminaries symbol quantity; model no. manufacturer; lamp type, voltage and numbers; type of mounting etc.
- Lighting layout can also used to display illuminanace calculation data.
- Fixture drawing and mounting details.
- Conduit layout, circuit number and power panel details.
- Conduit schedules are prepared separately for installation of the lighting conduit system providing details of lighting circuits for each conduit. Example for the this is provided in Chapter 7.
- Separate layouts should be provided for indoor (refer Figure 8.22) and outdoor areas (please refer Figure 8.23).
Figure 8.22 is an example for the lighting and conduit layout for an indoor area. The drawing shows various types of lighting fixtures (shown with the help of symbols e.g. LT11, LT13, etc.) used for the illumination of the area. The legend provides the details for the type of fixture. The drawing also provides the circuit number (through an arrow) and the path of the conduits connecting to the fixtures for a respective circuit. For example circuit no. L3 connects to six LT8 type fixtures.
Figure 8.23 is an example of for the lighting layout of the outdoor area. The drawing also shows the illuminance levels of the area. A section of the drawing has been enlarged to show the location of the lighting fixtures AR1 and AR2. The drawing also has sections showing the lighting fixture schedule and luminaries drawings.
Figure 8.24 is another example showing the lighting layout for the pump area of a plant. The drawing shows the illuminance levels and has sections for a lighting fixture schedule and illuminanace calculation summary.

Notes section in a lighting layout

Legend section in a lighting layout

Indoor lighting layout


Outdoor lighting layout with illuminance levels


Pump area lighting layout with illuminanace levels
Lighting fixture mounting details
Luminaries installation details can be vital in communicating mounting intent and should be included with the drawing documentation. Typically, rough detail sketches showing the preferred lighting installation geometry are generated by the lighting system manufacturer and then passed on to both the architect and electrical engineer for further refinements. The architect would then provide appropriate detailing that clearly defines how the fixtures are supported or how surrounding materials are effected, while the engineer may add notes or clarification regarding the routing of conduit/circuiting. Refer to Figure 8.25 for example of a rough sketch for fixture mounting.

Sketch showing lighting fixture mounting detail
Lighting poles and junction box/pull box details wiring diagrams
Separate drawings are developed to show the details of lighting pole General Arrangement, wiring diagram, pole base wiring arrangement, pull box details, etc. Figures 8.26 and 8.27 are examples for the same.


Lighting pole details example – 1


Lighting pole details example – 2
8.4 Applications of layout drawings
Layout drawings are used for:
- Installation of lighting, earthing, lightning protection systems.
- Equipment installations.
- Layout drawings are used for checking maintenance, safety and statutory requirements.
- Detailed bill of materials can be worked out on the basis of layout drawings.
- Various civil/structural drawings are worked out on the basis of the layout drawings.
8.5 Summary
Project execution requires inter-discilplinary co-ordination e.g. layout drawing for the electrical equipment would be referred by the various departments apart from the electrical such as the civil and the mechanical. Also the installations need to be carried out inline with the safety recommendations of the statutory bodies such as the NFPA/NEC and the local governing agencies which give permissions for these installations based on the electrical schedules and the layout drawings. Schedules are a systematic way of presenting list of equipment, fixtures or devices in a tabular form in a proper organized manner. The layout is an accurate development of the conception of the design, or the placement of units.
The various types of electrical layouts used in a plant are the lighting, lightning protection systems, earthing and cabling layouts.
Exercises
Refer to Figure 8.9.
1. What is the number of fence earth electrodes shown in the diagram?
2. What is the number of 3.6 mtr earth rods shown in the diagram?
Refer to Figure 8.22.
3. What is the number of track lights (model no. 067-2005-W) shown in the diagram?
4. Prepare a bill of material for the lighting fixtures shown in the drawing mentioning the fixture type, model no., mounting and quantity.
5. How many fixtures and of which type are connected to circuit no. L/5?
6. Prepare a circuit schedule for the circuits and fixtures displayed in the drawing mentioning the quantity and type of fixtures attached to each circuit.
Refer to Figure 8.23
7. What is the type of lamps and number of lamps used in each of the fixtures shown in the diagram?
9
Advances Arising from Computer Aided Drafting (CAD)
This chapter explains revolution brought into the design office by the invention of CAD softwares, advantages of CAD, its applications and some of the salient features of the CAD.
Learning objectives
- To familiarize the readers with the advantages brought in the process of drafting by the invention of CAD software, its applications and links to CAM, GIS related applications, etc.
- To familiarize the readers with the salient features of CAD such as drawing to true dimensions, symbol libraries, automated bill of material generation, information sharing, concept of layers, etc.
9.1 Drawing office revolution by CAD and the role of PC based CAD applications
9.1.1 Introduction to CAD and its history
Computer aided drafting or Computer aided drawing, is the computerized version of the hand drafting process that used to be done, with a pencil and ruler on a drawing table. A CAD system is a software application that can create and store drawings, which can be viewed, printed, or updated as required and is available for use in multiple operating system/hardware platforms. CAD is an electronic tool that enables you to make quick and accurate drawings with the use of a computer. Drawings created with CAD have a number of advantages over drawings created on a drawing board. CAD drawings are neat, clean and highly presentable. Electronic drawings can be modified quite easily and can be presented in a variety of formats. This is a type of software, which enables users to create rapid and precise drawings and rough sketch plans of main products or systems. It provides a flexible pattern in the drawing process that users can alter according to their required dimensions with minimal efforts. This software has all built in features as per users need and comes with many templates and symbols, for designing and drafting purposes, which gives it a wide area of application. It is the primary geometry-authoring tool used for all 2D and 3D designing purposes. It is useful for engineers, architects, and other designing professions. CAD programs have been created for many different computer platforms, some of the most powerful CAD tools such as Pro/Engineer by Parametric Technology corp. and AutoCAD by Autodesk, INC. are available for the PC workstation and even large scale platforms.
CAD systems have evolved from the days of their introduction in the 1950s. The operation of the Drawing Office underwent a series of major revolutions in the 1960s and 1970s. Initially, due to CAD’s high price, only a few professionals could afford it and CAD was earlier used only for specific engineering applications that required high precision, However, computer prices decreased significantly and affordable PC based CAD applications came into widespread use since mid 1980s with more and more professionals taking advantage of CAD. These affected not only the layout of the department but also the whole way in which the design function was managed and how designers and draughtsmen carried out their day-to-day responsibilities. Its development to link with Computer Aided Manufacture (CAM) was another major achievement. Both were to have a profound effect on the way in which different departments of an organization inter-reacted, broke down barriers between these departments and significantly improved the organization’s competitiveness. CAD is useful in various designing fields such as architecture, mechanical and electrical fields being some of them.
9.1.2 Important capabilities of CAD
Editing
CAD offers editing facilities such as:
- Enlarge or reduce parts of a drawing
- Add one drawing to another
- Stretch a drawing to fit new dimensions
- Make multiple copies of a drawing element
- Change the size and style of text
- Change units of measure, accuracy and style of dimensions
Accuracy
High level of accuracy can be achieved through CAD. If the user needs to create highly accurate geometrical shapes, CAD is the answer. The main reason for high accuracy is the use of vector file format as opposed to pixel based (also known as raster image) format commonly used in non-CAD image applications. A vector format defines drawings on the basis of a few entities (line, arc, circle, poly-line, etc.) which are expressed mathematically. These vector elements are comprised of line segments whose length represents magnitude and whose orientation in space represents direction. Vector image files are easier to modify and are resolution independent. Transformation in the display mode such as enlarging, rotation, lateral movements etc. are achieved through mathematical operation (on the other hand raster images when working with raster images, you edit groups of pixels rather than objects or shapes.Hence these images are difficult to modify and are impacted by scaling). It can help avoid time-consuming mathematical calculations. One can work with different units of measure, such as architectural units, engineering units, scientific units and surveyor’s units. These units are represented in standard formats commonly used by professionals.
One can create fine drawings with hundreds of colors, line types, hatch patterns, presentation symbols and text styles. There are a number of ready-made presentation symbols and hatch patterns available in CAD that can be used to enhance the look of drawings. In addition to preparing impressive presentations on paper, one can use CAD to make on-screen presentations. One can plug in the computer into a projector and present the ideas on-screen. Advanced CAD programs even allow the user to create animated images. The user can illustrate how a building would appear while walking through it, or how a machine would function when different machine assembly parts operate.
Storage and access of drawings
CAD drawings can be stored in a very organized and convenient manner on the computer. It results in savings in working space- CAD drawings can be accessed in seconds from the hard disk. These drawings also do not age and fade away with time.
Creating precise product design
By successfully integrating the geometrical and mathematical functions, with the design generating function, CAD systems have the ability to produce very precise product designs. Further, they allow both interactive and automatic analysis of design variants, and the expression of designs in a form suitable for manufacturing. CAD systems allow users to view a design from any angle with the push of a button and to zoom in or out for close-ups and long-distance views. Additionally, they keep track of design dependencies. Thus, if a value in the design is changed, all other values that depend on it are automatically modified accordingly.
9.1.3 Benefits of CAD systems
With the advent of 3D modeling and its advanced features, CAD systems can create photo-realistic product images. This gives manufacturers the ability to manipulate 3D models as if they were actual solid objects and a replica of an existing object or concept. Additionally, with advanced 3D modeling functionality, CAD systems are becoming popular with media companies for creating animations.
All-in-one manufacturing solution – Factory automation systems, such as CAD/CAM and CAD/CAM/CAE, are increasingly being used by manufacturers to streamline their production. CAD systems are also used in robotics. Such systems allow NC programming to create actual products, or even for graphic development for the animation industry.
Product management – Under CAD, techniques like Concurrent Engineering and Product Lifecycle Management (PLM) were developed. These techniques have allowed organizations to reengineer their entire design and production process.
9.2 2D and 3D applications and links to CAM
9.2.1 Evolution of CAD/CAM systems
2D stands for two dimensional view which are with only X, and Y axes. 3D stands for three dimensional view which are with X, Y and Z axes. From being able to merely develop flat two-dimensional drawings, CAD can now create dynamic and mathematically enriched three-dimensional (3D) models. These systems enable companies to produce cost-effective and precise illustrations of physical systems.
Three dimensional designs started in CAD programs during the late 1980s as a way to allow designers to view their designs from all possible angles on screen. Today most CAD programs provide different ways to design, display, animate, and print 3D objects called models. For example wire frame models represent 3D shapes by displaying their outlines and edges. Many CAD programs also work with solid models which work by giving the user a representation of a block of solid material. The user can then use different operations (cutting, adding, combining, and so on) to shape the material and create a finished model. CAD programs can render the image, shading in the solid parts and creating output that looks almost real. This can be fed into machines such as CNC (Computer Numerical Controlled), by taking the inputs from the models by defining the contour; the real parts can be manufactured. Hence, 3D models are very useful in CAM (Computer Aided Manufacturing).
The late 1950s saw the introduction of the first generation of CAD systems. They were primarily utilized in the Aviation, Automobile and Electronics Industries, and helped companies in these areas engineer their products. These CAD systems ran off specially designed computers – and this was a practice that was prevalent until the mid-1980s. High cost, coupled with slow and complex usage restricted their market. Since then, technology advancements have caused CAD systems to evolve as cost-effective and efficient applications that run on general-purpose workstations and personal computers.
9.2.2 The main phases in the evolution of CAD
Paper drafting to 2D models
With the introduction of 2D CAD models several benefits were offered which included customization drawings, ease of modification as per requirement and also easy storage, archival and retrieval facilities. However there was a major drawback with this model as the ‘depth’ dimensions could not be measured.
2D to 3D models
Precise depth dimensions are critical for the representation of complex physical models. The need for added functionality in the CAD software with 3D was felt which instigated the 2D to 3D evolution. 3D capabilities allow the users to draw pictorial views such as isometrics, oblique views and perspectives. The views drawn with CAD are very accurate and provide a lot of flexibility. The user can rotate a model on the screen just like an actual model and display views from different angles. Designers often use 3D to visualize designs and to make presentations. It helps them understand how an object will appear from different angles. Using additional rendering programs can further enhance the drawings. 3D models fall into the following categories:
Wire-frame model
A wireframe model of an object is the simplest geometric model that can be used to mathematically represent it. The word ‘wireframe’ is related to the fact that one may imagine a wire that is bent to follow the object edges to generate the model. A wireframe model consists entirely of points, lines, arcs, circles, conics and curves. These models appear to be made of wires and everything in the background is visible. This does not create a very realistic effect. From an application and engineering point of view, although wireframe models are of limited use, these models are simple to construct and are expected to last and may extend to certain classes of solid modeling.

Wireframe models
Surface model
Surface models are considered to be an extension of the wire-frame model. Surface model is more complete and a less ambiguous representation. They take the modeling of an object one step beyond wireframe models by providing information on surfaces connecting the object edges. Typically a surface model consists of wireframe entities that form the basis to create surface entities. It is actually an extension of the wireframe model and wireframe models can be extracted from the surface model by simply deleting all surface entities. While surface models provide a precise definition of surfaces and handle complex geometries, they are slow to render, are computationally intensive and do not further CAD/CAM automation and integration goals.
Surface model
Solid model
Solid modeling (sometimes called the volumetric modeling) techniques began to develop in the late 1960s. By the late 1970s, solid modeling had gained enough credibility to penetrate the commercial market.
A solid model is unique from the surface model in the topological information it stores which potentially permits functional automation and integration. Typically, a solid model consists of both the topological and geometrical data of its corresponding object. Geometry is the actual dimensions that define the entities of an object whereas the topology is the connectivity and associativity of the object entities. Topology has to do with the notion of neighborhood i.e. it determines the relational information between object entities. The difference between the geometry and topology has been explained in Figure 9.3a.
Defining an object with a solid model is the easiest of the available three modeling techniques (curve, surface and solids). Solid models can be quickly created without having to define individual locations as with wireframes. As an example, if a solid is to be created from a block with six cylinders subtracted, it would be a cumbersome process whereas it can be done in a much easier way with the help of solid modeling.

Geometry and topology

Solid model
3D models to CAM
Computer Aided Manufacturing (CAM) systems assist in manufacturing units and include tools such as real time controls and robotics. Most CAM systems use CAD drawings to produce the machine code required to manufacture the physical components depicted in the illustrations – such systems are known as CAD/CAM systems. The conceptual overlap between design and manufacture is suggestive of the potential benefits of CAD and CAM and the reason they are generally considered together as a system. The development of computer-aided design had little effect on Numeric Control (NC) machines initially due to the different capabilities and file formats used by drawing and machining programs. However, as CAD applications such as Solid Works and AutoCAD incorporate CAM intelligence, and as CAM applications such as MasterCam adopt sophisticated CAD tools, both designers and manufacturers are now getting an increasing variety of CAD/CAM software. Most CAD/CAM softwares were developed for product development and the design and manufacturing of components and molds. They are used with the Numeric Control (NC) machines. Through the NC path generators (used to define a tool path), these systems feed a set of sequential manufacturing instructions into the NC machines that will direct the motion of a machine tool to machine the exact shape that was drawn.
Today, over three-quarters of new machine tools incorporate CNC technologies. These tools are used in every conceivable manufacturing sector, including many that affect building technologies. CNC technology is related to Computer Integrated Manufacturing (CIM), Computer Aided Process Planning (CAPP) and other technologies such as Group Technology (GT) and Cellular Manufacturing. Flexible Manufacturing Systems (FMS) and Just-In-Time Production (JIT) which are made possible by Numerically-Controlled Machines.
CAM applications are also available for casting and molding processes where material volume change (such as shrinking) and extractability (of the component) from the mold are considered within the application while designing molds for specific components represented as 3D models.

Evolution of CAD/CAM systems
9.2.3 Offshoots of CAD
CAD systems have been integrated with major automation systems and some of the major offshoots are shown in Figure 9.5.
Offshoots of CAD
9.3 Drawing to true dimensions in CAD applications
Drawing scales are used to relate the size of the object being drawn to the image on the paper. When drawings were created by hand, the object may have been drawn at the same size or smaller or larger than the actual object to fit properly on a piece of paper. Annotation and symbols were drawn the same size, regardless of the object scale.
CAD has changed the way that drawing scales are applied. Objects may now be drawn at their actual size in the CAD file and reduced or enlarged when printed. CAD programs provide a high degree of precision. If the user wants to draw a line that is 12.396754 inches long or a circle with a radius of 0.90746 centimeters a CAD programs can fulfill the needs of the user. CAD programs are so precise that they can produce designs accurate to the micrometers or one millionth of a meter. This accuracy also extended to the other end of the scale. Not only can one design the tiniest objects in a CAD program, one can also design the largest object in full scale. Hence, in CAD programs the dimensions can be obtained as true dimensions and to the scale. The size of annotation and symbols vary depending on the printing scale. For instance, if a drawing is printed at 1/2 its actual size, text that is 1/8″ in the CAD file will appear 1/16″ on the print. To have the text print at a height of 1/8″ it must be drawn 1/4″ in the CAD file. Surface texture symbols, revision symbols, balloons and other symbols would be drawn or inserted at twice their intended printed size to appear correctly on the print. The border, title block and other charts would also be drawn or inserted at twice their printed size.
The benefits of creating objects at full size are many. Distances and areas can be accurately extracted from the CAD file. Objects from different drawings can be combined without regard to drawing scale, allowing designers to assemble designs electronically. Dimensioning is more efficient because the user does not need to calculate distances, but simply indicate the locations being dimensioned. The geometry in the file can be used by manufacturing software to create tool paths. The chart below (Figure 9.6) lists several standard engineering and architectural drawing scales with the printing adjustment

Scales in CAD
Another most important feature of CAD is support for true associative dimensioning. This new feature can be seen in two forms: geometry-driven dimensioning and transspatial dimensioning. Geometry-driven dimensioning automatically updates an object’s dimensions as the object is edited. Transspatial dimensioning enables the user to dimension model space objects from paper space, automatically updating the paper space dimension as one edits the model space object. Together, these two dimensioning features expand upon the associative dimensioning found in earlier releases of CAD.
9.4 Use of symbols, attributes and symbol libraries
Engineering drawings require symbols which are needed to be drawn again and again. CAD provides special directories which act as symbol libraries and can be accessed whenever a symbol is needed. Extensive libraries with customized symbols have been built for specific CAD applications for the different streams such as:
- Architectural
- Mechanical
- Electrical
- Process plant and piping
Many CAD applications refer to symbols as ‘BLOCKS’.
Electrical CAD software packages are specifically designed for electrical and control drawings. These offer a complete range of powerful tools to reduce development costs and shorten the design cycle, including automatic wire numbering, automatic component tagging, automatic generation and synchronization of panel layout drawings – complete with automatic dimensions, automatic terminal generation and much more. Electrical CAD offers ease of use, basic drag and drop, and requires no expensive and time-consuming training. Designed for minimal typing, this software helps reduce the development cycle by more than 300% compared to non-electrical specific software. Standard and user created symbols are intelligent, can assume multiple forms, and can be used for both horizontal and vertical drawings, with automatic text positioning and symbols in a drawing, enabling users to concentrate on safety and electrical design rather than drawing. The software contains an extensive set of standard – and intelligent – electrical symbols which can assume multiple forms as well as automatic horizontal and vertical text positioning.
Electrical CAD systems use symbols specifically created for electrical drawings. These symbols are usually divided into categories such as:
- General electrical drawing symbols
- Power symbols
- Lighting symbols
- Grounding symbols etc.
Some of the symbols used in CAD are shown below:


Symbols in CAD
9.4.2 Symbol attributes
Attributes are information data tags attached with a block or symbol. It is the text that can be attached to a block that conveys more information than just the geometry of the symbol on its own could convey. Attributes attributed find wide use in extraction of a bill of materials and for enhancements such as facility management systems and maintenance management systems. Please refer to Figure 9.8 for example of an electrical drawing with symbol attributes shown in green and yellow. Also refer to Figures 9.9a and 9.9b for an example of commands available in CAD for defining and editing of attributes.

Symbol attribute

Defining symbol attribute

Commands for symbol attributes
9.4.3 Symbol scaling
CAD applications have an in-built feature known as ‘symbol scaling’ whereby symbols need not be defined to fixed dimensions and can be scaled to represent different objects of similar nature (with different scales in different axes).
Refer to Figures 9.10 and 9.11 which explain the use of symbol scaling in CAD.

Symbol scaling – scale schematic

Scale schematics
9.5 Automated bill of material generation from a CAD drawing
Working with schedules and bill of materials are a critical component of any project. Creating these documents presents many unique challenges. CAD/CAM environment allows an indented bill of materials to be imported to the CAD/CAM environment while retaining the characteristics as a primitive text file. The conceptual design tool uses a sketch sheet approach on a computer display to enter the functional design of a new or modified product, thereby encouraging the designer to use a top down approach to the design process. The user keys in the item information, and the system automatically draws a hierarchical tree structure on the computer display. The system then automatically generates an indented bill of materials. From this file an image of the bill of materials can be displayed in the CAD/CAM environment.
9.6 Information sharing on multi-disciplinary drawing
The CAD drawings can be shared by a number of users, allowing them to coordinate projects and work as a team. This is accomplished by connecting different computers via a network. For example in an engineering project, different professionals such as architects, engineers and construction managers can use the same set of CAD drawings to coordinate the different services. If a change is made to the drawings, this information becomes available to all the team members automatically. With the use of modems and the Internet, it has become far easier to share information. Most architects and engineers these days share drawings electronically. The user can also publish the drawings on the Internet and collaborate on CAD projects using a web site. Many CAD programs include special functions that allow the user to export drawings in a format that can be viewed on the Internet.
9.7 Concept of layers and their use in sharing information
Another important feature of CAD programs is their ability to define; layers which are like transparent layers of film that can be placed on top of each other. Layers permit CAD users to organize complex drawing. The user can draw on these imaginary surfaces and group drawing objects on different layers. This helps in organizing CAD drawings and makes editing much easier. The layers can be turned ON and OFF to view or edit specific objects. Using layers the user can control the display of specific information on the screen by turning a combination of screen ON or OFF. Layers are commonly used in professional architecture and engineering drawings where co-ordination between the different services is required. For example, a structural engineer designing an office building might create layers such as electrical, plumbing, and structural and so on. The designer engineer can then show and hide these individual layers, while different parts of the building are designed. The concept of layering has become so useful to designers that many paint and drawing programs now provide layering capabilities that function in much the same manner as CAD system.
Layers are given specific characteristics that distinguish them from each others. Each layer has a specific color and line type. Whatever is drawn on that layer is drawn with that specific color and line type. This color coding helps to identify which drawing objects are placed on which layer. Please refer to Figures 9.12—9.15 which explain the concept of layers in CAD. While Figure 9.14 shows the same drawing with layers of lighting, appliances and plumbing; Figure 9.15 shows the same drawing without these layers.

Layers in CAD -1

Layer property manager

Architectural drawing showing layers for lighting, appliances and plumbing

Architectural drawing without lighting, appliances and plumbing details
9.8 Automation of drawing through programming
Sometimes, software ‘in the box’ cannot fully meet the specific need of the user. Business and technical priorities have to be identified to revolutionize the way of working by customizing the design applications through AutoCAD programming.
Through customization of CAD, the following can be achieved:
- Automatic generation of drawings, bills of materials.
- Faster design and production of working prototypes.
- Reduced engineering change order cycle time.
- Improved data quality and consistency.
- Automation of plotting production assignments.
- Increased workload capacity without increased labor costs.
- Increased utilization and personal productivity of professional employees.
- Custom software to blend corporate databases with drawings and supplier lists.
- Secured customer and supplier access to drawings and product information.
- Automated design rules and drawing production processes.
- Automated drawing production/data management standards.
- Seamless data interfaces between different software applications, database formats, and access point technologies.
9.8.1 Parametric programming in CAD
Parametric programming concept involves programs that draw different shapes when given different parameters. Parametric programming can be performed with a combination of CAD commands and an interactive graphic programming language (like Auto LISP with AutoCAD). CAD does not have the provision for programming of numerous parameters at a time of regeneration of complex figures, and programs such as Auto LISP are used for such applications.
The primary advantages of parametric programming is that a general figure can be defined once in a parametric form and, a whole family of figures can be drawn from the original. Each time the figure is referenced, the original definition is used with the variable parameters to recreate the figure. From a programming standpoint, it can take a good deal of time to set up the initial definitions of the parametric Figure and the variable parameters. However lot of time can be saved for applications where repetitive use of figures is required as in electrical and instrumentation schematics.
On the following pages are examples in parametric programming.
Example 1: A simple program in Auto LISP to match linetypes:

Parametric programming example in Auto LISP
Example 2: An auto lisp program for calculating the quantities of a selected electrical component by getting its block name

Parametric programming example in Auto LISP
INITIAL STATEMENT ABOUT THE PROGRAMME

BODY OF THE PROGRAMME (EXTENSION OF THE FILE IS .LSP)


Parametric programming example in Auto LISP

Parametric programming example in Auto LISP

Parametric programming example in Auto LISP
CODING FOR BLOCK SELECTION AND MESSAGE IF THE SELECTION IS RIGHT

DISPLAY OF THE BLOCK NAME

Parametric programming example in Auto LISP
CODING TO PRINT THE BLOCK NAME


Parametric programming example in Auto LISP


Parametric programming example in Auto LISP
9.9 Linking imagery with drawings – GIS related applications
9.9.1 GIS (Geographic Information System)
GIS (Geographic Information System) technology provides a computerized mechanism for capturing, verifying, storing, manipulating, querying, analyzing, and displaying geospatial data referenced to their location on earth. GIS technology has evolved from the computerized applications of cartography and map analysis which were first developed in the 1960s. However, its practicality and widespread use have only been realized in fairly recent years due to the rapid advancement of computer hardware and operating system software capabilities. There are two primary graphic structures for GIS: raster and vector. In raster GIS, graphic features are stored as an array of cells (pixels) referenced by row and column numbers. In vector GIS, geographic features (i.e. entities) are represented by three primitive geometrical entities: points, lines, and polygons. Data associated with a geographic entity are stored in a database for subsequent access. Without an attached attribute database, a line is simply a string of x-y coordinate pairs (vector) or cells (raster), with a known location relative to some coordinate system. The attribute data for a line, stored within the database, provide additional information about the line (e.g., the type of entity represented by the line, its characteristics, etc. The basic components of a GIS are: (1) the software (including application software and DBMS software), (2) the computer platform (i.e., hardware and operating system), (3) the data, (4) the people who use, operate, and maintain the GIS, and (5) procedures. Today, the GIS market is growing and changing at a rapid pace. Also, the gap between the capabilities and operational characteristics of traditional CAD and GIS software is rapidly narrowing. GIS combines the use of CAD technology and Relational Database Management System (RDBMS) technology to relate data to features on digital maps and drawings and to allow for the creation, storage, maintenance, retrieval, query, analysis, and display of various geospatial information.
9.9.2 GIS capabilities
- Displays and prints drawings.
- Shows relationships between features ( for example valves are connected to pipes as a database requirement)
- Provides database query for the information to make informed decisions.
- Accepts additional data easily and maintains project data once construction is complete.
- Scales from one person to hundreds with no changes in the system interface.
- Handles many types of data including photographs, video clips, and sound.

GIS image showing location and photograph of problem in transmission line
9.9.3 How is GIS different from CAD?
The key difference lies in the roots of each technology. CAD is rooted in drafting — CAD has a great facility for creating and representing geographic features as drawings in a computer. GIS is rooted in data management — it has a great facility for geographic features and their related attributes in a computer database. This basic difference results in a profound difference in how each technology stores map data in the computer. Please refer to Figure 9.18 which explains the various applications of GIS in industry, asset management and facilities management.

Uses of GIS

Representation of points and lines in GIS
- CAD geometry is primarily constructed by a draftsman whereas GIS geometry is scanned, digitized or surveyed.
- CAD geometry contains many horizontal and vertical lines. Lines at regular angles are common. GIS geometry contains virtually no horizontal or vertical lines and, apart from right angles, other regular angles are rare.
- In CAD, circular arcs and curves are essential, in GIS they are virtually non existent. Some GISs do not even have a way of representing a curve, despite their frequent occurrence in urban areas.
- In CAD a typical polygon has few vertices, often four; in GIS a polygon may have many thousands of vertices.
- In GIS, operations such as mirror, rotate, scale and copy are unusual; on the other hand lines of a ‘fractal’ nature, such as contours and coastlines, are common.
- In CAD, schematic drawings, such as those used to represent electrical circuitry, are extremely stylized; but in GIS, the layout bears a close resemblance to the real world.
- CAD is drawing-based and manages data as drawing files or a set of drawing files. The set of drawing files can be a set of map tiles that share a common coordinate system but are physically disjointed. The main product of a CAD system is a paper map. The geometric entities in most CAD systems lack intelligence and are thus unable to ascribe meaning or serve as the basis for calculating derivative information (e.g. the length of a line, the area of a region bounded by lines) and are thus unable to ascribe meaning or serve as the basis for calculating derivative information (e.g. the length of a line, the area of a region bounded by lines).
- GIS is database-oriented and thus tends to handle data in a single seamless database. (Please refer to Figure 9.19 which shows points and lines stored in database form in GIS). Since GIS has always held the possibility of managing data over a wide geographic extent, it includes many tools for map projections and for handling large data volumes.
9.9.4 Need to integrate CAD and GIS
Power, communication and public health utilities often need to relate information from schematics with their geographical locations. Linking of GIS (raster) information with vector information of CAD drawings helps in integrating schematic and location data in a single file. GIS users can drop CAD drawings into place with other map data and display just the CAD data needed with high quality GIS cartography (please refer to Figure 9.20 for example of CAD and GIS integration).
Reasons for integrating CAD and GIS:
- CAD and GIS are interrelated
- Interoperability is becoming more accepted
- Promotes information sharing and standardization of procedures
- Reduction of redundancies in data collection and maintenance
- Increases functionality and efficiency
- Presents an opportunity to lead the way for positive organizational changes
- Provides for the formation of strategic alliances
- Creates new efficiencies
- More effective and efficient data distribution
- Integration can enhance the work many design and other professionals do
- Engineers, Architects, Planners, and other CAD users can gain a better understanding of complex issues by using integrated spatial data.

Integration of CAD and GIS

Integration of CAD and GIS

Interoperability of CAD and GIS
9.10 Summary
Computer aided drafting or Computer aided drawing, is the computerized version of the hand drafting process that used to be done, with a pencil and ruler on a drawing table. A CAD system is a combination of hardware and software that can create and store drawings, which can be viewed, printed, or updated as required. CAD is an electronic tool that enables you to make quick and accurate drawings with the use of a computer. Drawings created with CAD have a number of advantages over drawings created on a drawing board. CAD drawings are neat, clean and highly presentable. Electronic drawings can be modified quite easily and can be presented in a variety of formats. This is a type of software, which enables users to create rapid and precise drawings and rough sketch plans of main products.
With the advent of 3D modeling and its advanced features, CAD systems can create photo-realistic product images. This gives manufacturers the ability to manipulate 3D models as if they were actual solid objects and a replica of an existing object or concept. These can be used for various purposes, from tweaking and perfecting the design to marketing the product. Additionally, with advanced 3D modeling functionality, CAD systems are becoming popular with media companies for creating animations.
Today most CAD programs provide different ways to design, display, animate, and print 3D objects called models. For example wire frame models represent 3D shapes by displaying their outlines and edges. Many CAD programs also work with solid models which work by giving the user a representation of a block of solid material. The user can then use different operations (cutting, adding, combining, and so on) to shape the material and create a finished model is finished, CAD programs can render the image, shading in the solid parts and creating output that looks almost real. This can be fed into machines such as CNC (Computer Numerical Controlled) by taking the inputs from the models by defining the contour; the real parts can be manufactured. Hence, 3D models are very useful in CAM (Computer Aided Manufacturing).
CAD has changed the way that drawing scales are applied. Objects may now be drawn at their actual size in the CAD file and reduced or enlarged when printed. CAD programs provide a high degree of precision. The benefits of creating objects at full size are many. Distances and areas can be accurately extracted from the CAD file. Objects from different drawings can be combined without regard to drawing scale, allowing designers to assemble designs electronically.
Working with schedules and bill of materials are a critical component of any project. Creating these documents presents many unique challenges. CAD/CAM environment allows an indented bill of materials to be imported to the CAD/CAM environment while retaining the characteristics as a primitive text file. Another important feature of CAD programs is their ability to define, layers which are like transparent layers of film that can be placed on top of each other. Layers permit CAD users to organize complex drawing. The user can draw on these imaginary surfaces and group drawing objects on different layers. This helps in organizing CAD drawings and makes editing much easier.
GIS (Geographic Information System) technology provides a computerized mechanism for capturing, verifying, storing, manipulating, querying, analyzing, and displaying geospatial data referenced to their location on earth. The key difference lies in the roots of each technology. CAD is rooted in drafting — CAD has a great facility for creating and representing geographic features as drawings in a computer. GIS is rooted in data management — it has a great facility for geographic features and their related attributes in a computer database. This basic difference results in a profound difference in how each technology stores map data in the computer.
Power, communication and public health utilities often need to relate information from schematics with their geographical locations. Linking of GIS (raster) information with vector information of CAD drawings helps in integrating schematic and location data in a single file.
10
Management of Drawings
This chapter explains the need for the development of systems for the management of drawings. It explains the various areas of drawing management systems including planning and assigning of drawings, drawing numbering standards, revision control, marking of comments and distribution of drawings.
Learning objectives
- To familiarize the readers with the procedures for planning, assigning, revision control and comments marking, for drawings.
- To familiarize the readers with the need for development of drawing management systems and reasons for the end of the era of paper drawings It also explains the role of drawings as a database for engineering and construction and the future of CAD.
10.1 Planning and assigning of drawings
To compete in today’s world, a company has to survive in a fast-growing, technologically driven environment of producing goods and services. How does a company develop the best product or service delivered to market at a fair price in the shortest time? For a company to maintain this competitive edge, it has to leverage its assets which include a tremendous amount of engineering designs and drawings. Tools and processes to efficiently modify these assets are essential. CAD provides the most productive environment in which to manage and modify engineering drawings. Once a work task has been assigned, the usual procedure in drawing departments is to divide work (task) among individual draftsmen. The CAD Manager or the Drawing Office In-charge can be used to set and supervise tasks. Every task can be associated with its executor i.e. the person responsible for a particular task, and validators who assess the drawing according to other criteria (technological, economic, etc.) A deadline date for the task to be completed and its priority can also be set. Every executor can likewise proceed at lower levels of the structure. This will result in a detailed overview of the particular product where each item has its executor, validator, and date by which it must be completed. These include:
- architectural components (i.e. walls, doors, windows, columns, etc.) which form the basis for as-built drawings.
- engineering components (i.e. structural elements, mechanical and electrical)
- building services components (i.e. fire, communication)
The Drawing Office in-charge usually prepares a submittal schedule based on the schedule received form the client’s end/ contract. Figure 10.1 shows an example of the submittal schedule received from the client’s end based on which further action is taken.

Submittal schedule
For any project a base co-ordination plan is required to be used as a basis for further design engineering and has to be issued to all persons working on the project. This reference plan drawing will identify the following:
- the surveyed site boundary
- the building set-out reference point
- the building grid
This drawing is accessed as an ‘x-reference’ file through CAD.
The person in charge of the project will then be responsible for the CAD file drawing co-ordination of all consultants.
Before assigning of drawings guidelines are provided to the individual draftsmen as mentioned below:
CAD drawing guidelines
- Co-ordination plan reference drawing
- Drawing file name
- Drawing layering system
- Layer colors, line types annotations
- Text styles and fonts
- Drawing dimensions, sheet sizes, scales
- Holds, levels, co-ordinates, amendments, reference drawings, etc.
General guidelines
- Guidelines for drawing control
- Guidelines for drawing numbering systems
- Guidelines for revision control systems
- Preparation of drawing register
- Title block template
10.2 Need for drawing numbering standards
There are at least four reasons for a standardized numbering system which are:
- to create consistent style and quality;
- to give users guidance in structuring their drawing file;
- to provide a structure for quality control over users’ drawings, and
- to facilitate organization and retrieval of documents.
The drawing numbering system must be flexible enough to accommodate existing local procedures. The system should attempt to co-ordinate the drawing numbers for traditional drawings and CAD. This will make the transition to CAD easier.
Drawing numbering (example-1)

Drawing numbering (example-2)
Drawing numbers are provided on the basis of the company standards. Often numbering standards include a separate number scheme as per the client’s requirements. Usually the drawing numbers provide the following details:
- Discipline area (e.g. mechanical/civil/electrical)
- Project description
- Revision details
- Drawing directory/file number
- Sequential number

Drawing numbering sequence
10.3 Drawing process flow
Every organization has a specific standard for the drawing process flow and the revision of drawings. Although it may different from organization to organization, the major steps are described below:
- Preparation of drawing submittal schedule mentioning the target dates, concerned persons for preparation, checking and approval.
- Preparation of drawing
- Checking and approval
- Submission of drawings to client
- Receipt of comments/approval
- Re-submission in line with the comments
- Release of drawings for construction /execution
- Preparation of as-built drawings as after execution of project.
The process flow diagram for drawings is shown in the Figure 10.5 below.

Drawing process
The process flow diagram for the revision is shown in Figure 10.6.

Revision process
10.4 Revision control and ownership of drawing
One of the most sensitive issues in current enterprises is how to identify the person who, for any reasons, has modified the drawing, or the validity of particular modifications and changes. The drawing office in-charge has to treat this issue in such a way that it does not allow modification of the item or drawing which have already been deemed valid and completed. It is, however, possible to create a new version of the drawing in a modification procedure. All possible consequences of a particular change are analyzed in the process of modification drafting, in which the initiator enters identification numbers of items to be modified. The assessment of the consequences will prevent items used in other projects from being modified, or such items can be modified in all of them if necessary. The modification proposal has to pass the validation procedure the same way as the original drawing itself. The person responsible for modification drafting and commissioned to perform it is provided with access to all the items listed in the approved modification drafting for their editing and modification. All changes and their drafts, including denied ones, can be viewed in a complete list of modifications. If necessary, it is possible to return to any of the previous versions.
Drawing revisions should follow a sequence as per the company standards. An example for the same is shown below with all initial revisions being alphabetic, all revisions issued for construction being numeric and all interim revisions being a numeric and alphabetic combination:

Revision control
Revision clouds with revision number triangles are usually used to surround the last revisions made to drawing. The clouds should only be used for the last revision. All other revisions should have the clouds removed.
10.5 Comments and their marking
Drawings need to be reviewed by several interested groups and all the comments must be noted on the drawings and studied by everyone else; at the same time original drawings should not get changed. This needs a viewing and redlining (markup) facility. Often the persons who review the drawing may not be proficient in the use of the CAD application itself. Therefore reviewing applications are usually standalone programs which operate on a separate file format which is different from the native format of the CAD application. DWF is an example of such a file format.
The DWF format first appeared in 1995 and was originally referred to as the Drawing Web Format, since DWF files were generated by the Autodesk Internet Publishing Kit. As the format grew in use beyond just AutoCAD, it was renamed to Design Web Format. Although originally a 2D-only format, DWF has evolved to include 3D. Today DWF files are generated by all Autodesk products. In addition, there are a variety of third-party applications that make use of the format.
DWF is an open, secure file format meant for the efficient distribution and communication of rich design data to anyone who needs to view, review, or print design files. Because DWF files are highly compressed, they are smaller and faster to transmit than design files, without the overhead associated with complex CAD drawings (or the management of external links and dependencies). With DWF functionality, publishers of design data can limit the specific design data and plot styles to only what they want recipients to see and can publish multisheet drawing sets from multiple AutoCAD drawings in a single DWF file. They can also publish 3D models from most Autodesk design applications.
DWF files are not a replacement for native CAD formats such as AutoCAD drawings (DWG). The sole purpose of DWF is to allow designers, engineers, project managers, and their colleagues to communicate design information and design content to anyone needing to view, review, or print design information – without these team members needing to know AutoCAD or other design software.
CAD offers special features for providing clear and concise mark-up and annotations including redline, freehand, stamping and custom symbols. The viewing, mark-up, and measure features of CAD extend beyond 2D to include 3D DWF files. Custom symbols provide a powerful way to annotate and mark-up information in the office or in the field. The user can create one’s own catalogue of symbols from any source, including block libraries published to DWF format from CAD software. The mark-up display can be changed according to different users or preferences. Built-in measurement and dimension tools help ensure accurate Snap-to-Fit Geometry Snap precisely to the drawing geometry, helping to ensure easy and accurate point-to-point measurement with the dimension tool. Lines, polylines, and area measurement precisely measure lines, polylines, and areas in drawings, or distance and angles in 3D models with built-in measurement tools. Increasing team productivity is easy with powerful status tracking that helps automatically track all mark-ups.
10.6 Drawing management system for work flow control
For any organization it is imperative that the drawing management process is clearly defined and understood. A proposal for a unified drawing management process should be developed based on the specific requirements of the organization.
Drawing management system is a solution that enables organizations to securely develop, store and deliver drawings online or through other forms of electronic document communication. Organizations depend on drawing management system, to improve efficiency and reduce the latency of communications, internally and to external business partners and customers. Drawing management system captures, organizes, and stores drawings in a centralized repository, extracts meaningful information, and automates the delivery of personalized content to individuals. Electronic drawing management is utilized to organize, distribute, standardize and control the process of how drawings are managed in a business environment. Features of drawing management systems are specifically designed to help the users achieve all their drawing control needs. With drawing management system in place it will allow the users to manage a drawing life cycle from start to end. There are several benefits from implementing a drawing control software solution. Some common benefits that may be achieved by using drawing management system are:
- Track versions that are stored in the drawing management system.
- Controls who checks out and checks in a drawing.
- Provides a form of labeling to make it easy to reference drawings.
- It maximizes search capabilities for drawings.
- Provides a form of a standard scheme for drawings across the company
- Can provide a central location for drawings.
10.6.1 Drawing management system involves the following:
Establishment of Team Data Exchange
Transfer of information is a rapidly evolving area with electronic transfer increasingly becoming the norm on construction projects. The effective exchange in digital form, particularly of drawn (CAD) information can provide a significant aid to the design development and co-ordination of a project. It is essential to discuss and establish with all interested parties at the earliest opportunity a policy for data transfer on each project. Both the extent of data transfer and the type of transfer media may have implications on the organization of the project team. This contact will need to establish the need to exchange data with the following parties:
- Within an office, between different CAD systems
- Between a company’s own offices
- Client organizations
- Survey organizations
- Co-consultants and sub-consultants (the design team)
- Contractors and sub-contractors
- Building maintenance consultants.
Incoming /Outgoing Issues
The procedure for incoming issues satisfies four main requirements:
- The current copy is easily identifiable throughout the project.
- A full archive of all received information is stored with an audit trail related to the sending company and the date received.
- A record set of all received documentation is retained in its original form to guarantee that the information is viewed as it was intended.
- Referenced information is not accidentally overwritten upon receipt of new documentation.
To ensure the recipients have the right data at the right time in order for the project to progress to schedule.
Responsibility
Responsibility for the introduction of data into a project should be defined at the outset of the project. This should ideally be a single point for all incoming and outgoing issues to provide consistency of approach and guarantee a record is maintained of all received information. The single point may be an individual such as a Drawing Office In-charge, CAD Co-coordinator, a Drawing Controller, or a Project In-charge. The process of checking in and approving received data may vary (e.g. email archive, distribution to key members of the team, copy into day-file, etc.). Drawing issues should be properly recorded as shown in Figure 10.8.

Drawing issue
10.7 On-line distribution of drawings – the end of the era of paper drawings
To compete in today’s world, a company has to survive in a fast-growing, technologically driven environment to produce goods and services. How does a company deliver the best product or service to market at a fair price in the shortest time? To maintain a competitive edge, a company must leverage its information assets, which includes a tremendous amount of engineering drawings and documents. Tools and processes to efficiently manage, distribute and modify these assets are essential. This is achieved through electronic procedures for developing, maintaining and distributing the drawings through the internet/intranet and thereby putting an end to the era of paper prints. Organizations are getting rid of the system of paper drawings mainly because of the following reasons:
- Paper drawings are easy to lose or misfile.
- Paper drawings are difficult to keep current, and an out-of-date drawing may be used accidentally.
- Paper drawings are expensive to correct or update.
- Paper drawings deteriorate with time.
- Paper drawings are costly to distribute.
- Accumulated paper is difficult to handle.
- Manual based revisions are costly and time consuming.
- Paper is cumbersome. It is often hard to find specific information in specific documents. Electronic searching is more efficient and faster.
Organizations can now give their shop floor workers online access to CAD drawings or put drawing libraries on an intranet so anyone – from sales to manufacturing to support – can quickly access them. They can even set up a Virtual Blueprint Room to give vendors access to drawings. CAD applications also have built-in PDF writer for converting native drawing files to PDF formats.
10.8 Drawing as a database for engineering and construction – the future
Engineering design produced by CAD are widely used by the engineering and construction industry which requires design, monitoring and execution of several disciplines such as civil, structural, mechanical and electrical. Engineering projects require several complex inter-disciplinary references, checks and co-ordination; any errors in these inter-related systems can lead to serious problems. CAD software has helped engineering and construction companies to accurately design and engineer these systems and help in the timely and efficient completion of the project.
The CAD acts as a database for the engineering and construction in the following ways:
- Centralize project related documents and information
- Works as a tool for preparation, mark up and review of drawings
- Automated bill-of-material generation
- Helps in monitoring of projects
In the present scenario CAD systems make it possible to share information quickly but yet there are some drawbacks. While drawings can be shared and it is possible to create additional drawings based on a mother document, simultaneous additions of information by independent groups is not something that is feasible with the present file-based approach. External referencing and linking features are useful but to a limited extent. A true relational database permits simultaneous updates on a selective basis by different users. Such a feature is not directly available from any CAD system. Perhaps in the future, systems with such an approach will become reality.
10.8.1 The future of CAD
Vision is the most accessible and pervasive of the senses. What we see constitutes our first impression, and many books are in fact judged by their covers. The basic CAD task has been the simulation of appearance; first, in the two dimensions of the picture plane, and then in the three dimensions of the model. In 2D the selection of viewpoint is critical, but in 3D irrelevant. Yet while the design object may be fully visible, it still remains untouchable. CAD can go far beyond its present state. A glance at the on-screen tools and commands displayed by most CAD systems indicates their origin as 2D drawing programs. Most tools are still varieties of 2D pictorial transformation (lines, arcs, etc.) and not 3D building elements (walls, roofs, etc.). The proprietary CAD data structure may not be sufficiently flexible to carry the range of information needed for analytical processing, much less communicate effectively with other systems. Solids modelers will eventually supplant the presently popular ‘enhanced’ 2D systems, and foster a different kind of working methodology which will, hopefully, no longer be called ‘drawing’.
10.9 Summary
To compete in today’s world, a company has to survive in a fast-growing, technologically driven environment of producing goods and services. How does a company develop the best product or service delivered to market at a fair price in the shortest time? For a company to maintain this competitive edge, it has to leverage its assets which include a tremendous amount of engineering designs and drawings. Tools and processes to efficiently modify these assets are essential. Once a work task has been assigned, a usual procedure in drawing departments is to divide work (task) among individual draftsmen. The Drawing Office in-charge or the CAD manager can be used to set and supervise tasks and for also laying out the guidelines necessary for the planning and assigning of drawings.
A drawing numbering system is required for every organization to help maintain consistent style. The drawing numbering system must be flexible enough to accommodate existing local procedures.
One of the most sensitive issues in current enterprises is how to identify the person who, for any reasons, has modified the document, or the validity of particular modifications and changes. The drawing office in-charge has to treat this issue in such a way that it does not allow modification of the item or document which have already been deemed valid and completed. It is, however, possible to create a new version of the document in a modification procedure. Drawing revisions should follow a sequence as per the company standards.
Often the persons who review the drawing may not be proficient in the use of the CAD application itself. Therefore reviewing applications are usually standalone programs which operate on a separate file format which is different from the native format of the CAD application. DWF is an example of such a file format.
CAD offers special features for providing clear and concise mark-up and annotations including redline, freehand, stamping and custom symbols. The viewing, mark-up, and measure features of CAD extend beyond 2D to include 3D DWF files. Custom symbols provide a powerful way to annotate and mark-up information in the office or in the field.
To maintain a competitive edge, a company must leverage its information assets, which includes a tremendous amount of engineering drawings and documents. Tools and processes to efficiently manage, distribute and modify these assets are essential. This is achieved through electronic procedures for developing, maintaining and distributing the drawings through the internet/intranet and thereby putting an end to the era of paper prints.
Engineering design produced by CAD are widely used by the engineering and construction industry which requires design, monitoring and execution of several disciplines such as civil, structural, mechanical and electrical. Engineering projects require complex several inter-disciplinary references and checks; any errors in these inter-related systems can lead to serious problems. CAD software has helped engineering and construction companies to accurately design and engineer these system and help in the timely and efficient completion of the project. A true relational database permits simultaneous updates on a selective basis by different users. Such a feature is not directly available from any CAD system. Perhaps in the future, systems with such an approach will become reality.
The basic CAD task has been the simulation of appearance; first, in the two dimensions of the picture plane, and then in the three dimensions of the model. In 2D the selection of viewpoint is critical, but in 3D irrelevant. Yet while the design object may be fully visible, it still remains untouchable. CAD can go far beyond its present state. A glance at the on-screen tools and commands displayed by most CAD systems indicates their origin as 2D drawing programs. Most tools are still varieties of 2D pictorial transformation (lines, arcs, etc.) and not 3D building elements (walls, roofs, etc.). The proprietary CAD data structure may not be sufficiently flexible to carry the range of information needed for analytical processing, much less communicate effectively with other systems. Solids modelers will eventually supplant the presently popular ‘enhanced’ 2D systems, and foster a different kind of working methodology which will, hopefully, no longer be called ‘drawing’.

Appendix B
Answers to Exercises
Chapter 4
1. Please refer to Figure 4.1.
Number of 200 A outgoing feeders: 3 nos
Rating of step down transformer : 1000 kVA
Current rating of buscoupler breaker: 1200 A
2. Please refer to Figure 4.2.
Total no. of 4.16 kV switchgear is 10:
5 in the generating station, 4 in the step down substation and 1 in the load center substation.
No. of step up transformers: 2 x 4.16/34.5 kV
Voltage on delta side of step down transformers: 34.5kv and 4.16kV respectively.
4.
| Relay No. | Function |
| 50 | Instantaneous Overcurrent |
| 51N | AC time overcurrent (Neutral) |
| 86 | Lockout Relay |
| 87 | Differential protective relay |
Chapter 5
Please refer to Figure 5.9.
1. K97 and K99 refer to sheet 8 (sections 8.6/E and 8.7/E) for details of the contactor coil for timer. Delta- wye timer contactor coil reference no. is K98.
Indication lamp no. for ‘MAIN MOTOR ON’ is H96 (refer sheet 8).
No. of NO contacts for K99 is 3.
No. of NC contacts for K99 is 2.
2.
| Contactor coil no. | Pressure switch tag no. |
| K 55 | S 55, S 56 |
| K 57 | S 57, S 58 |
| K 59 | S 59, S 60 |
3. NC contact of K184 has been utilized for the indication of ‘FAULT in LUB’.
4. Contacts of overload relays Q6, Q12, Q14, Q16, Q18, Q32 have been utilized for operation of the ‘EMERGENCY STOP’.
Chapter 6
Please refer to Figure 6.6.
1.
i. No. of ‘OR’ gates: 1
ii. No. of ‘AND’ gates: 2
iii. No. of ‘NOT’ gates: 2
Gate 1 is an ‘AND’ gate and will get energized only when each of the following conditions is met:
– Limit switch signal from field for valve open is active.
– Signal from safety interlock circuit is not active.
– Selector switch is in ‘AUTO’ position.
Gate 2 is an ‘OR’ gate and it gives a high output either if the input from the Gate 1 is high or the selector switch is in ‘OPEN’ position. If the input signal from safety interlock is ‘high’, then the output of Gate 1 will be low and the valve will not get energized in the ‘Auto’ mode. However, a manual bypass to the interlock circuit is provided through ‘Gate2’ which can give a high output if the selector switch is in ‘OPEN’ position.
The two conditions are:
i. In automatic mode when each of the following is true:
- Limit switch for valve open position is active
- Signal from safety interlock is not active
- Selector switch is in ‘AUTO’ position
ii. In manual mode
- Selector switch is in ‘OPEN’ position
Please refer to Figure 6.7.
2.
i. No. of ‘OR’ gates: 5
ii. No. of ‘AND’ gates: 5
iii. No. of ‘NOT’ gates: 2
‘Start’ signal is sent to the field under the following conditions:
– Start permissive circuit is active
AND
-Start PB is activated OR Auto Start is activated
‘Pump fail’ signal is used to reset the ‘START’ signal going to the field and the Auto Start mode so that the pump cannot be started through ‘Auto start’ once ‘pump fail’ signal has been received.
‘Pump ready’ signal is displayed under the following conditions:
When each of the following signals is not activated (is low):
– Process trip
– Auto stop
– Pump fail
– Stop PB (manual)
AND start permissive signal is high.
Chapter 7
Please refer to Figure 7.1
1.
LT-r1: Cable run for outside lighting; cable purpose- power cable (lighting cable serial no. 1)
SQ1 – q3- QPL: Cable run starting from 480 V switchgear (cable serial 3) to Oil Transfer Pump (Lube); cable purpose: power circuit
2. Please refer to attached drawing with the highlighted sections of new cable trays. The approx. length of cable trays to be calculated with the help of the scale given, i.e. 1 inch = 30 ft.

New cable trays and fittings as per the notes section provided in the drawing:
(5) – 24” cable tray
(6) – 30” X 24” horizontal tee fitting
(7) – 30” cable tray
(8) – 30” X 30” horizontal tee fitting
3. No. of proposed pull boxes shown in the diagram is 1.
No. of existing pull boxes shown in the diagram is 3.
4.
Cable name is W2 (3 core)
| Conductor | Used for |
| sw | valve forward |
| bl | 24V DC |
| PE | Valve forwards |
5.
Terminal strip no.: X1
Terminal strip nos 3 and 4 are used for terminating the cable from tachometer to generator G1.
Chapter 8
Please refer to Figure 8.9.
1. No. of fence earth electrodes – 9.
2. No. of 3.6 m earth rods – 8.
Please refer to Figure 8.22
3. No. of track lights (model no. 067-2005W) shown in the diagram is 30 (fixture code no.: LT 13 Typ)
4.
| Lighting fixture code | Quantity in nos |
| LT 8 | 12 |
| LT 4A | 4 |
| LT 13 | 30 |
| LT 11 | 16 |
| LT 9 | 2 |
| LT 14 | 2 |
| LT 8 NL/EM | 2 |
5. No. of fixtures connected to ckt. no. L/5 is 6 x LT 8 and 2 x LT 8 EM/NL.
6.
| Ckt. No. | Lighting fixture code | Qty in nos. |
| L/13 | LT 4A | 4 |
| L/7 | LT 13 | 10 |
| L/9 | LT 13 | 8 |
Please refer to Figure 8.23
7.
Fixture type AR1 uses 250W metal halide lamp 1 no.
Fixture type AR2 uses 250 W metal halide lamp 2 nos.


Professional Certificate of Competency in Advanced TCP/IP-Based Industrial Networking
Designed for engineers and technicians who need practical knowledge in…Read more
Professional Certificate of Competency in Allen Bradley Controllogix / Logix5000 PLC Platforms
Designed for engineers and technicians who need practical knowledge in…Read more
Professional Certificate of Competency in Arc Flash Protection
Designed for engineers and technicians who work in the electrical…Read more
Professional Certificate of Competency in Chemical Engineering and Plant Design
Designed for engineers and technicians who need practical knowledge in…Read more
Professional Certificate of Competency in Circuit Breakers, Switchgear and Power Transformers
Designed for engineers and technicians who need practical knowledge regarding…Read more
Professional Certificate of Competency in Control Valve Sizing, Selection and Maintenance
Designed for engineers and technicians who need a solid understanding…Read more
Professional Certificate of Competency in Electrical Power System Fundamentals for Non Electrical Engineers
Designed for engineers and technicians who need to understand the…Read more
Professional Certificate of Competency in Electrical Power System Protection
Designed for engineers and technicians who need practical skills and…Read more")
Professional Certificate of Competency in Electrical Wiring Standards: AS/NZS 3000:2018 (Australia and New Zealand Only)
This professional development course is designed for engineers and technicians…Read more
Professional Certificate of Competency in Fundamental E & I Engineering for Oil and Gas Facilities
Designed for engineers and technicians who need to update their…Read more
Professional Certificate of Competency in Gas Turbine Engineering
Designed for engineers and technicians who need practical skills in…Read more
Professional Certificate of Competency in Hazardous Areas and Intrinsic Safety For Engineers and Technicians
Designed for engineers and technicians who need to understand the…Read more")
Professional Certificate of Competency in Heating, Ventilation and Air-Conditioning (HVAC)
Designed for engineers and technicians from a wide range of…Read more
Professional Certificate of Competency in IEC 61850 Based Substation Automation
Designed for engineers and technicians who need to understand the…Read more
Professional Certificate of Competency in Industrial Data Communications
Designed for engineers and technicians who need to understand how…Read more
Professional Certificate of Competency in Instrumentation, Automation and Process Control
Designed for engineers and technicians who need to gain practical…Read more
Professional Certificate of Competency in Machine Learning and Artificial Intelligence
This professional development course is designed for engineers and technicians…Read more
Professional Certificate of Competency in Mechanical Engineering
This professional development course is designed for engineers and technicians…Read more
Professional Certificate of Competency in Onshore and Offshore Pipeline Systems
Designed for engineers and technicians who need to gain an…Read more
Professional Certificate of Competency in Power Distribution
designed for engineers and technicians who need to gain a…Read more
Professional Certificate of Competency in Practical Machine Learning Using Python for Engineers and Technicians
Designed to use Python Programming to work with machine learning…Read more
Professional Certificate of Competency in Practical Python for Engineers and Technicians
Designed for engineers and technicians who need to understand the…Read more & SCADA Systems")
Professional Certificate of Competency in Programmable Logic Controllers (PLCs) & SCADA Systems
Designed for engineers and technicians who need to get practical…Read more
Professional Certificate of Competency in Project Management for Engineers & Technicians
This professional development course is designed for engineers and technicians…Read more
Professional Certificate of Competency in Safety Instrumentation Systems for Process Industries
Professional development course designed for engineers and technicians who want…Read more
Professional Certificate of Competency in Sewage and Effluent Treatment Technologies
Designed for engineers and technicians who need practical skills and…Read more
Professional Certificate of Competency in Structural Design for Non Structural Engineers
Professional development course designed for engineers and technicians who need…Read more")
Professional Certificate of Competency in Substation Design (Main Equipment)
Professional development course is designed for engineers and technicians who…Read more")
Professional Certificate of Competency in Substation Design (Control, Protection and Facility Planning)
Designed for engineers and technicians who need to gain practical…Read more
Professional Certificate of Competency in the Fundamentals of Process Plant Layout & Piping Design
Professional development course is designed for engineers and technicians who…Read more
Professional Certificate of Competency in Practical Mechanical Sealing
This professional development course is designed for engineers and technicians…Read more
Professional Certificate of Competency in Road Construction
This professional development course is designed for engineers and technicians…Read more
Professional Certificate of Competency in Specification and Technical Writing
Master the art of writing clear, accurate, and professional technical…Read more
Professional Certificate of Competency in Hydraulics and Pneumatics
Overview of all aspects related to the construction, design, operation,…Read more
Professional Certificate of Competency in Big Data and Analytics in Electricity Grids
This course explores the use of big data & data…Read more
Professional Certificate of Competency in Renewable Energy Systems
This course covers various renewable energy systems that are popular…Read more
Professional Certificate of Competency in Smart Grids
A smart grid is an electricity network that uses digital…Read more
Professional Certificate of Competency in Hydrogen Energy – Production, Delivery, Storage and Use
Hydrogen energy short course designed for engineers and professionals interested…Read more")
Professional Certificate of Competency in Building Information Modelling (BIM)
This professional development course is covering practical aspects of using…Read more
Professional Certificate of Competency in Industrial Internet of Things
Internet of Things (IoT) is the most sort after technology…Read more